Reason to trust
How Our News is Made
Strict editorial policy that focuses on accuracy, relevance, and impartiality
Ad discliamer
Morbi pretium leo et nisl aliquam mollis. Quisque arcu lorem, ultricies quis pellentesque nec, ullamcorper eu odio.
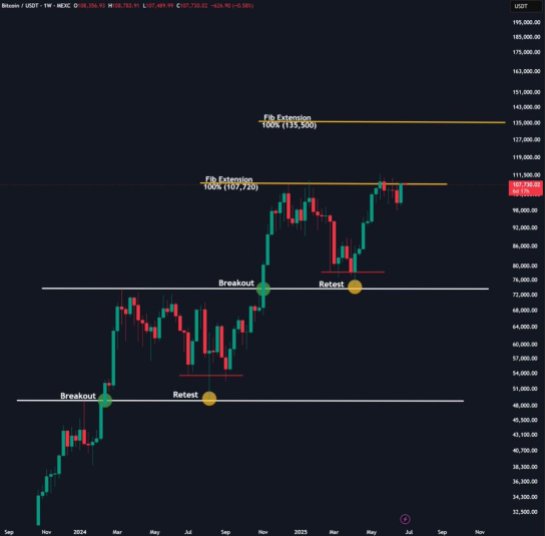
Bitcoin is at a pivotal point, and the weekly close could define its next move. To confirm bullish continuation and strengthen market confidence, BTC needs to secure a solid weekly close above $107,720.
Bitcoin Weekly Candle Could Set The Stage For A Run
Bitcoin is approaching a make-or-break moment, but if BTC can secure a strong weekly close above $107,720, it could trigger a move toward the $130,000 to $135,000 range in Q3. This key level is acting as a resistance zone, and breaking it could unlock a new wave of bullish momentum.

SatheMeme_Expert revealed on X that a similar setup had appeared in Q4 2024, when BTC posted its biggest weekly close of the year. The result was an unstoppable rally that shattered resistance and fueled one of the strongest bullish legs of the cycle.
The weekly chart shows Bitcoin is trading within a well-defined historical parallel channel. As mentioned by Pinnacle_Crypto, this channel has previously marked a breakout point in October 2023 and October 2024, which fueled upward moves. If this pattern continues, BTC could be on track to reach the $150,916 target in October 2025. The channel provides a roadmap, with key breakouts that signal the start of rallies. Alongside, price dips will serve as accumulation zones.
Crypto analyst Gemxbt also highlighted that Bitcoin’s 1-hour chart is currently in a downward trend, but the price is attempting to bounce off a support zone near $106.500. So far, this area is holding firm, providing a foundation for buyers to step in, and technical indicators support this potential shift.
The Relative Strength Index (RSI) is recovering from oversold levels, hinting that selling momentum is waning, while the Moving Average Convergence Divergence (MACD) indicator is nearing a bullish crossover, which could signal the start of upward momentum. However, for a meaningful reversal to hold, BTC must overcome the critical resistance near $108,500. A breakout above with sustained volume will be crucial to confirm the trend and bullish momentum.
Consolidation Phase Matures — Breakout May Be Imminent
BTC is consolidating inside a descending channel formation on the daily chart, a pattern that typically reflects a phase with a broader trend. Dynamite Trader emphasized that BTC is currently trading above the 50-day moving average (MA 50), a technical level that is now solid for the bulls.

A breakout above the descending channel would mark a shift in sentiment and momentum, potentially triggering a bullish continuation toward the $120,000 region, the next psychosocial target on the macro chart.
According to MiraCrypto, Bitcoin has shown a strong breakout from the descending channel on the 1-day chart, signaling a shift in momentum. BTC is now consolidating above the resistance, which has turned into support.
This consolidation above the breakout levels is a bullish continuation signal seen before the next leg higher. MiraCrypto noted that as long as BTC holds this zone, the path remains open for a move toward $135,000.