
Reason to trust
How Our News is Made
Strict editorial policy that focuses on accuracy, relevance, and impartiality
Ad discliamer
Morbi pretium leo et nisl aliquam mollis. Quisque arcu lorem, ultricies quis pellentesque nec, ullamcorper eu odio.
Bitcoin is currently correcting higher from the $4,320 support area against the US Dollar. BTC could rally further if the bulls are able to push the price above $6,800 and the 100 SMA (H4).
- Bitcoin price seems to be facing a strong resistance zone near the $6,800 and $7,000 levels.
- The 100 simple moving average (4-hours) holds the key for the next move.
- There is a key bearish trend line forming with resistance near $6,680 on the 4-hours chart of the BTC/USD pair (data feed from Kraken).
- The pair could either rally above $6,800 or it might decline back towards the $5,200 level.
Bitcoin is Approaching Major Hurdle
This past week, bitcoin started an upside correction after it forming a decent support base above $4,000 against the US Dollar. BTC price gained momentum above the $4,500 level and traded above the $5,000 resistance.
The bulls were able to push the price above the $5,500 resistance. As a result, there was a sharp upward move above the $6,000 level. However, the rally faced a major hurdle near the $7,000 level and the 100 simple moving average (4-hours).
A swing high was formed near $6,979 and the price is currently correcting lower. It broke the 23.6% Fib retracement level of the recovery wave from the $4,328 low to $6.979 high.
On the downside, bitcoin is finding strong bids near the $5,800 level. The 50% Fib retracement level of the recovery wave from the $4,328 low to $6.979 high is also acting as a support.
On the upside, the bulls are facing a major barrier near the $6,800 level and the 100 simple moving average (4-hours). There is also a key bearish trend line forming with resistance near $6,680 on the 4-hours chart of the BTC/USD pair.
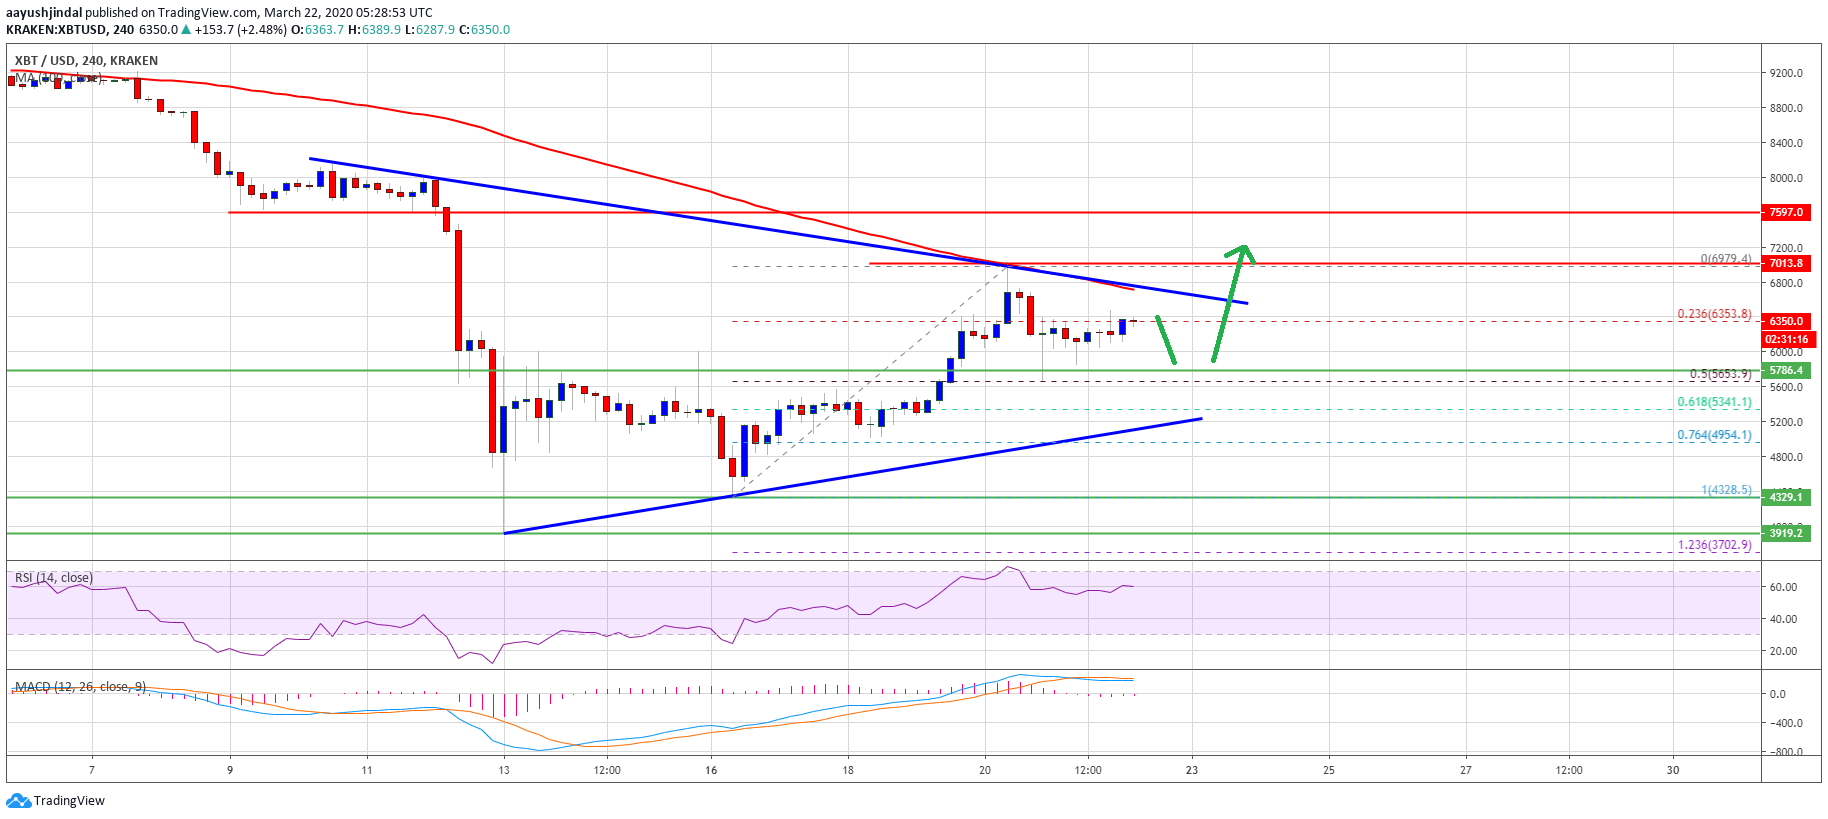
If the pair gains bullish momentum above the trend line, 100 SMA, and $6,800, there are high chances of a solid surge towards the $7,500 and $7,800 levels in the near term.
Fresh Decline
The main support for bitcoin is forming near the $5,800 level. The next key support is near the $5,200 level and a connecting bullish trend line on the same chart.
A successful break below the $5,200 support could restart the last decline. In the stated case, the price is likely to slide back towards the $4,500 and $4,200 support levels.
Technical indicators
4 hours MACD – The MACD for BTC/USD is about to move back into the bullish zone.
4 hours RSI (Relative Strength Index) – The RSI for BTC/USD is currently well above the 50 level.
Major Support Level – $5,800
Major Resistance Level – $6,800


