
Reason to trust
How Our News is Made
Strict editorial policy that focuses on accuracy, relevance, and impartiality
Ad discliamer
Morbi pretium leo et nisl aliquam mollis. Quisque arcu lorem, ultricies quis pellentesque nec, ullamcorper eu odio.
- Bitcoin price settled above the key $5,000 hurdle and tested the $5,240 resistance against the US Dollar.
- The price faced a strong selling interest near the main technical barrier at $5,240-5,260.
- There is a major connecting bullish trend line formed with support near $4,200 on the daily chart of the BTC/USD pair (data feed from Kraken).
- The pair corrected recently, but it is likely to make another breakout attempt above $5,240.
Bitcoin price started a massive bull-run above the $4,500 and $5,000 resistances against the US Dollar. BTC is currently struggling near the $5,240 resistance, but more upsides seems possible.
Bitcoin Price Analysis
In the past two days, we saw a nasty upward move above the $4,500 resistance in bitcoin price against the US Dollar. The BTC/USD pair even climbed above the $5,000 resistance and settled well above the 100-day simple moving average. During the recent rise, there was a break above a couple of important resistances near the $4,000 and $4,200 levels (green area). It opened the doors for a sharp rally above the $4,800 and $5,000 levels.
More importantly, there was a break above the 50% Fib retracement level of the last significant drop from the $6,559 high to $3,122 low. The price settled above the $5,000 resistance area and recently tested the next major hurdle near $5,240-5,260. It represents the previous swing low near $5,250 (red line). Besides, the 61.8% Fib retracement level of the last significant drop from the $6,559 high to $3,122 low is also near the $5,240 level. Therefore, the recent downside correction was from a crucial technical resistance near $5,250.
Having said that, downsides are likely to be limited since there are many supports near $5,000, $4,900 and $4,840. If there is an extended correction, the price could test the $4,600 or $4,550 support. There is also a major connecting bullish trend line formed with support near $4,200 on the daily chart of the BTC/USD pair. The main support is near the previous breakout area near the $4,200 level.
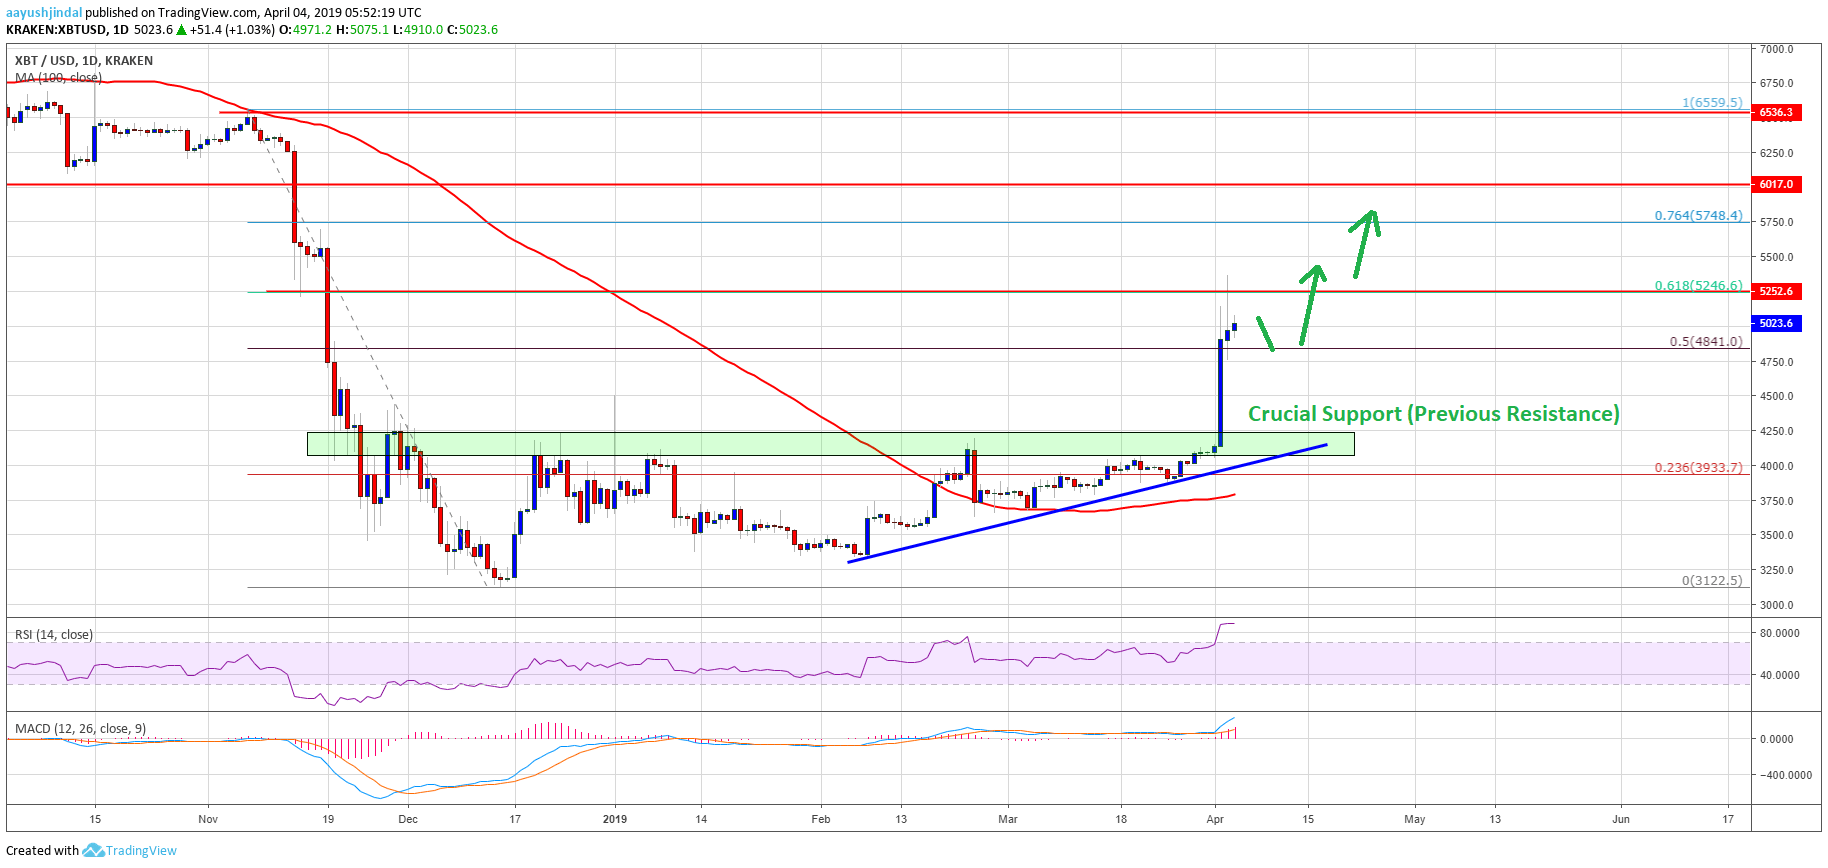
Looking at the chart, bitcoin price clearly moved into a strong uptrend above $5,000. It is currently facing a crucial resistance near $5,240, above which there are chances of more upsides towards the $5,500 or $5,750 level. The final stop for buyers could be $6,000 if there is a proper follow through above $5,500. On the downside, buyers are likely to remain active near $4,840 or $4,600 in the near term.
Technical indicators:
Daily MACD – The MACD is placed heavily in the bullish zone.
Daily RSI (Relative Strength Index) – The RSI for BTC/USD climbed above the 80 level and currently flat near 87.
Major Support Levels – $4,840 followed by $4,600.
Major Resistance Levels – $5,250, $5,500 and $5,750.


