
Reason to trust
How Our News is Made
Strict editorial policy that focuses on accuracy, relevance, and impartiality
Ad discliamer
Morbi pretium leo et nisl aliquam mollis. Quisque arcu lorem, ultricies quis pellentesque nec, ullamcorper eu odio.
- Bitcoin price recovered recently above $7,900 and $8,000 against the US Dollar.
- The price failed to stay above $8,000, formed a swing high at $8,080, and recently declined below $7,900.
- There is a key breakout pattern forming with resistance near $7,940 on the hourly chart of the BTC/USD pair (data feed from Kraken).
- The pair is currently under pressure and there is a risk of more losses below the $7,800 support.
Bitcoin price failed to gain momentum above $8,000 and declined recently against the US Dollar. BTC is currently approaching the next break and it might breakdown if the bulls struggle near $7,950.
Bitcoin Price Analysis
Recently, bitcoin price started a decent recovery above $7,800 and $7,900 against the US Dollar. The BTC/USD pair even broke the $8,000 barrier and the 100 hourly simple moving average. However, the price failed to gain bullish momentum and formed a swing high at $8,080. As a result, there was a fresh decline below the $8,000 support area. The price broke the 23.6% Fib retracement level of the recent recovery from the $7,520 swing low to $8,080 high.
There was also a spike below $7,900 and the 50% Fib retracement level of the recent recovery from the $7,520 swing low to $8,080 high. Finally, the price broke the $7,800 support area before the bulls took a stand near the $7,750 level. Moreover, the 61.8% Fib retracement level of the recent recovery from the $7,520 swing low to $8,080 high acted as a strong support. At the moment, the price is trading above $7,800 and the 100 hourly SMA. More importantly, there is a key breakout pattern forming with resistance near $7,940 on the hourly chart of the BTC/USD pair.
Therefore, the pair seems to be preparing for the next break either above $7,950 and $8,000 or below $7,800. If there is an upside break above $8,000, the price is likely to climb further higher. A follow through above $8,080 is likely to put the bulls in control. The next important resistance is near the $8,200 level. On the downside, an initial support is near the $7,800, below which the price could decline again towards $7,600.
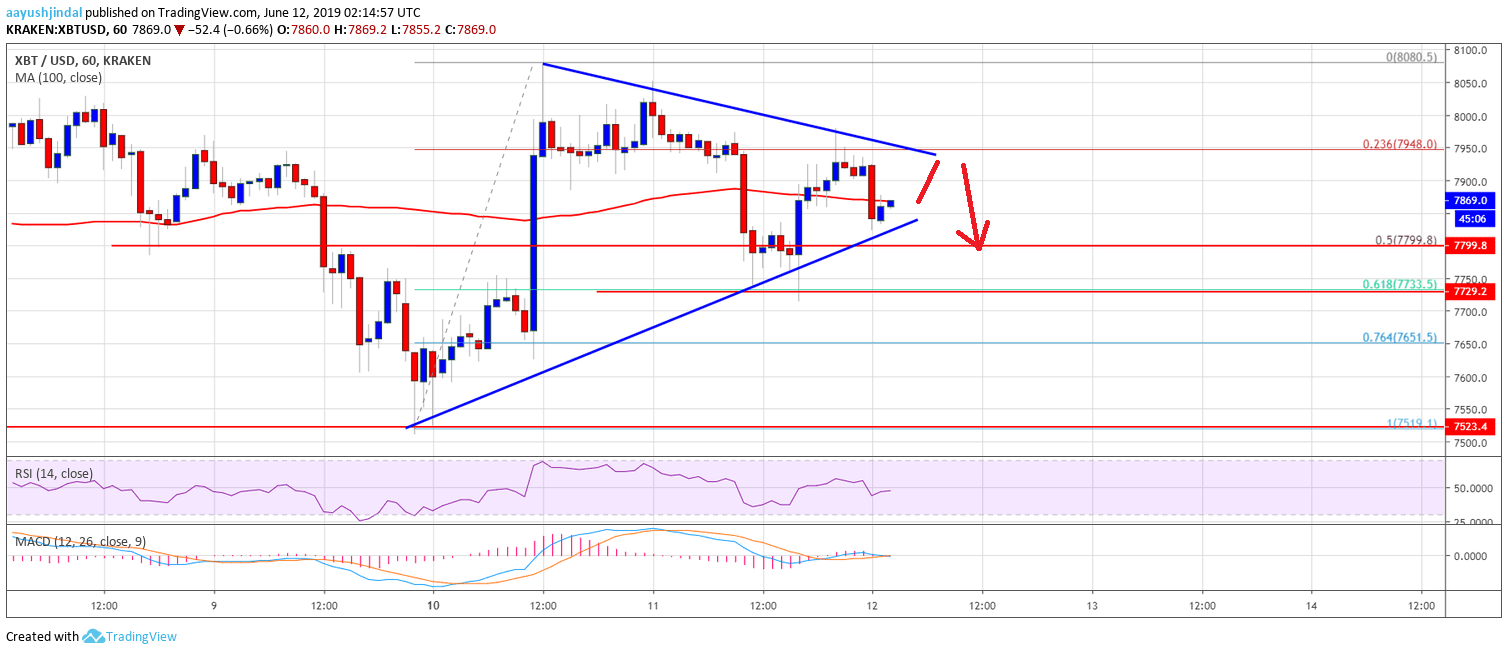
Looking at the chart, bitcoin price is showing a few bearish signs below $8,000 and $7,900. If there is a fresh decline below $7,800, the price could move back in a bearish zone. It may also diminish the chances of a break above $8,200.
Technical indicators:
Hourly MACD – The MACD is losing momentum in the bullish zone.
Hourly RSI (Relative Strength Index) – The RSI for BTC/USD is currently below the 50 level and is moving higher.
Major Support Levels – $7,800 followed by $7,700.
Major Resistance Levels – $7,950, $8,000 and $8,080.


