
Reason to trust
How Our News is Made
Strict editorial policy that focuses on accuracy, relevance, and impartiality
Ad discliamer
Morbi pretium leo et nisl aliquam mollis. Quisque arcu lorem, ultricies quis pellentesque nec, ullamcorper eu odio.
- Bitcoin price failed to climb above $8,800 and declined sharply below $8,400 against the US Dollar.
- The price failed to hold the key $8,250 support and it even spiked below the $8,000 support.
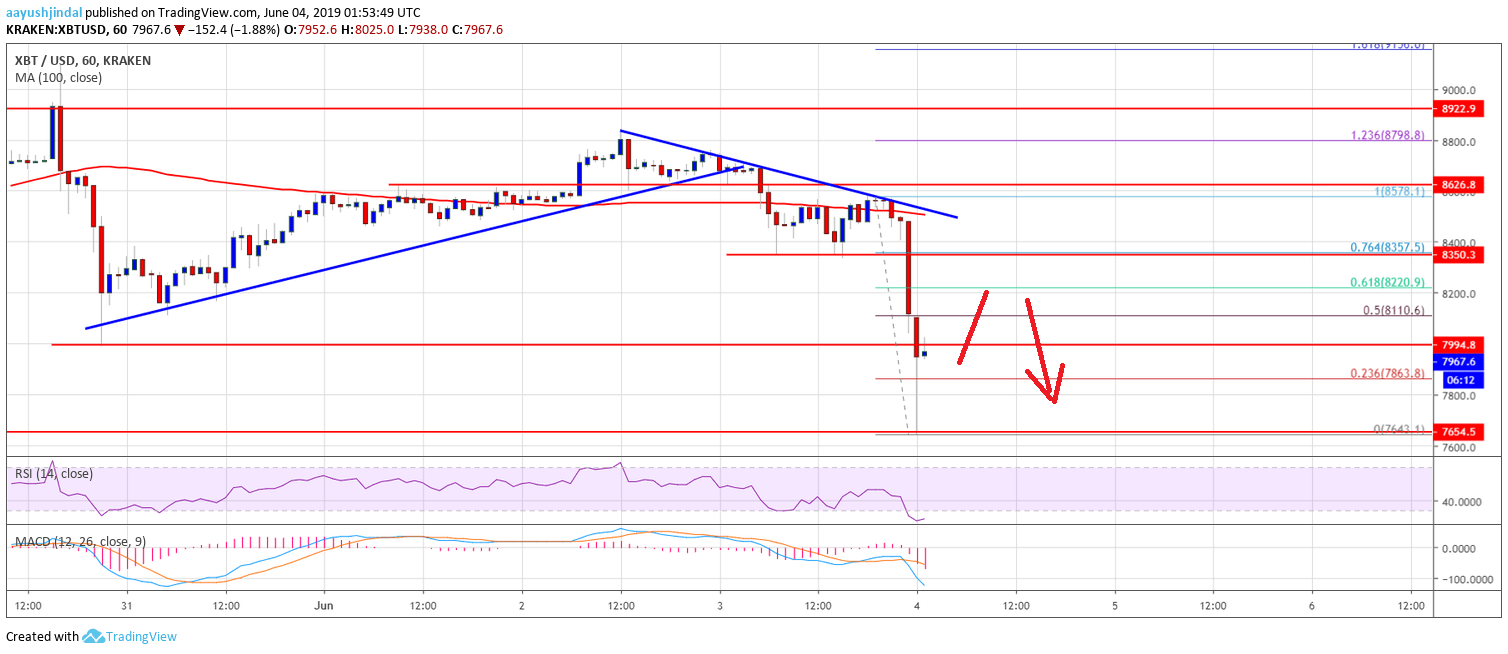
- There is a major bearish trend line forming with resistance near $8,440 on the hourly chart of the BTC/USD pair (data feed from Kraken).
- The pair is currently correcting higher, but it is likely to face sellers near $8,200 and $8,350.
Bitcoin price is currently trading in a bearish zone below $8,400 against the US Dollar. BTC could start a sharp upward move above the $8,800 and $8,850 resistance levels.
Bitcoin Price Analysis
After a steady rise, bitcoin price faced sellers near the $8,800 level against the US Dollar. The BTC/USD pair failed to clear the $8,800 resistance and recently started a downward move. There was a sharp decline from the $8,578 swing high below the $8,400 support area. The price even settled below $8,220 and the 100 hourly simple moving average. The decline was such that the price even spiked below the $8,000 support area. A new weekly low was formed near $7,643 and the price is currently correcting higher.
It is currently trading near $8,000 and above the 23.6% Fib retracement level of the recent decline from the $8,578 high to $7,643 low. On the upside, an initial resistance is near the $8,100 area. The 50% Fib retracement level of the recent decline from the $8,578 high to $7,643 low is also near the $8,110 level. If there is an upside break above the $8,110 level, the price may even recover above $8,200. The main hurdles on the upside are near $8,350 and $8,400. Moreover, there is a major bearish trend line forming with resistance near $8,440 on the hourly chart of the BTC/USD pair.
The trend line coincides with the 76.4% Fib retracement level of the recent decline from the $8,578 high to $7,643 low. Moreover, the 100 hourly SMA is also near the $8,400 resistance area. Therefore, if the price corrects higher, it is likely to face a strong resistance near the $8,400 area.
Looking at the chart, bitcoin price clearly moved into a bearish zone below $8,400 and $8,200. In the short term, there could be more losses and sellers are likely to remain active. Only a close below $8,400 might reverse the recent decline. On the downside, the main supports are near $7,650 and $7,440.
Technical indicators:
Hourly MACD – The MACD is currently gaining momentum in the bearish zone.
Hourly RSI (Relative Strength Index) – The RSI for BTC/USD declined sharply below the 40 level, with a bearish angle.
Major Support Levels – $7,650 followed by $7,440.
Major Resistance Levels – $8,200, $8,400 and $8,500.


