
Reason to trust
How Our News is Made
Strict editorial policy that focuses on accuracy, relevance, and impartiality
Ad discliamer
Morbi pretium leo et nisl aliquam mollis. Quisque arcu lorem, ultricies quis pellentesque nec, ullamcorper eu odio.
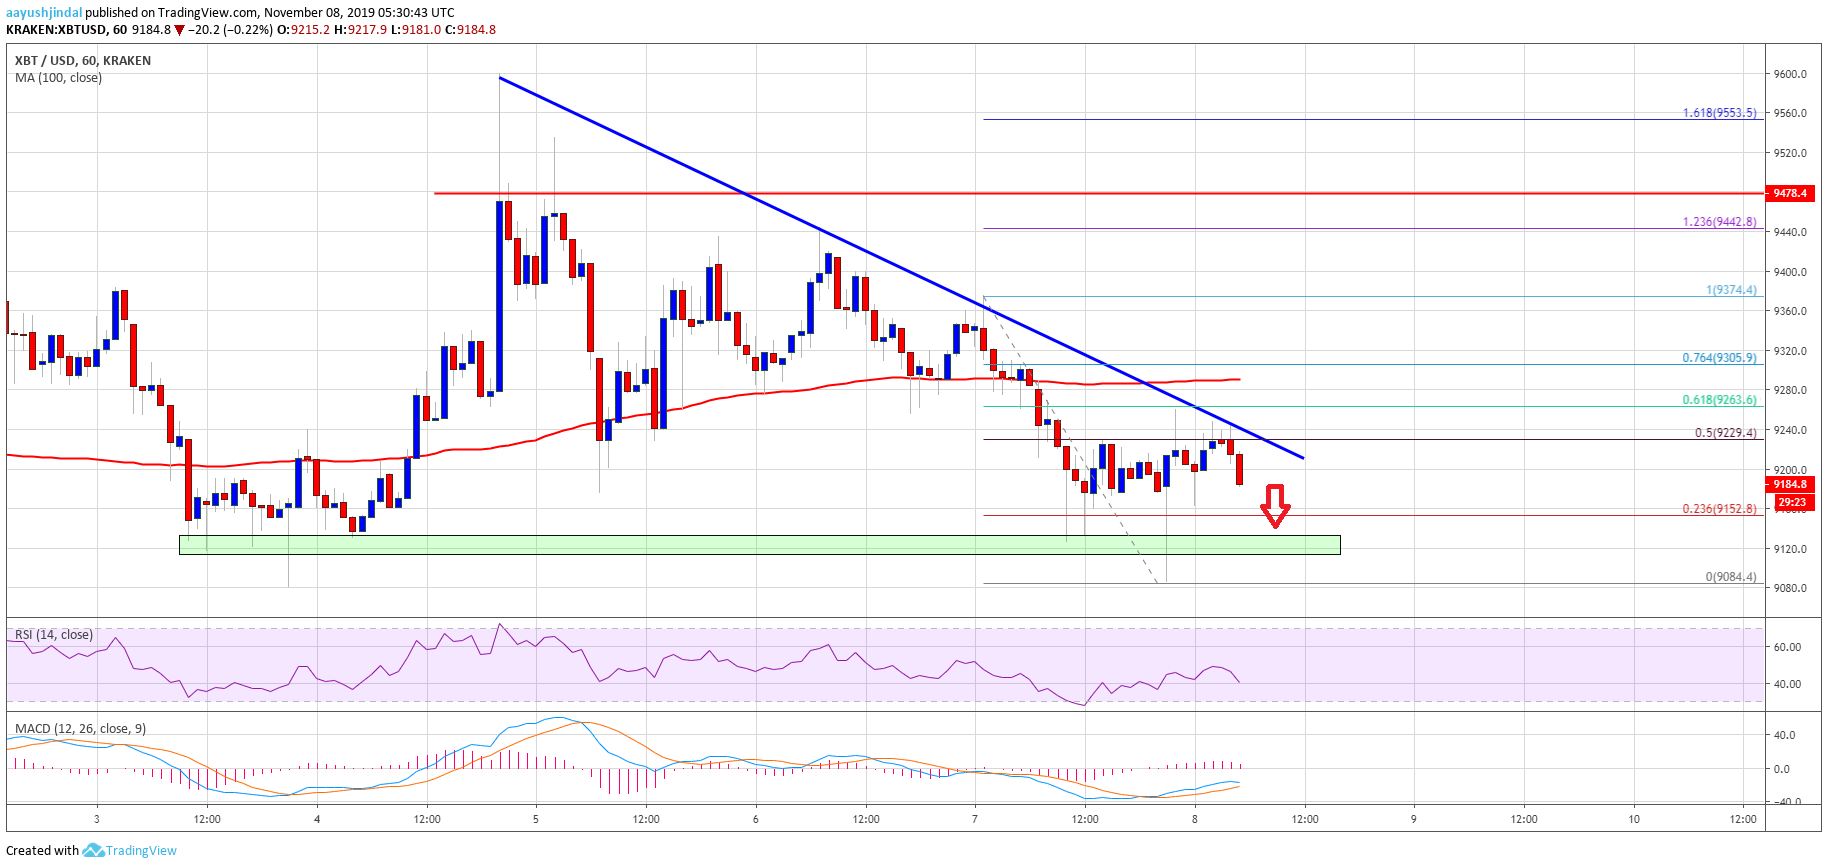
- Bitcoin price is struggling to rebound and declining below the $9,300 support against the US Dollar.
- The price is likely to accelerate decline if it breaks the $9,120 support area.
- There is a major bearish trend line forming with resistance near $9,240 on the hourly chart of the BTC/USD pair (data feed from Kraken).
- Similarly, there were bearish moves in Ethereum and ripple in the past three sessions.
Bitcoin price is showing bearish signs below $9,300 and $9,240 against the US Dollar. BTC price could accelerate losses if it continues to struggle below $9,300.
Bitcoin Price Analysis
In the past few hours, there was a steady decline in bitcoin from the $9,440 high against the US Dollar. The last swing high was near $9,374 before the price declined below the $9,300 support area.
Moreover, there was a close below the $9,300 support and the 100 hourly simple moving average. Finally, the price spiked below the $9,120 support area and traded as low as $9,084.
It is currently correcting higher above the $9,120 level. Additionally, it surpassed the 50% Fib retracement level of the recent decline from the $9,374 high to $9,084 low.
However, the price is facing a lot of hurdles on the upside near the $9,240 and $9,300 levels. More importantly, there is a major bearish trend line forming with resistance near $9,240 on the hourly chart of the BTC/USD pair.
The 61.8% Fib retracement level of the recent decline from the $9,374 high to $9,084 low is also capping the upward move. Therefore, a successful break above the trend line and a follow through above $9,300 is needed for a fresh increase.
The next key resistance is near the $9,440 area, above which bitcoin is likely to climb towards the $9,550 and $9,600 levels in the near term.
On the downside, an immediate support is near the $9,120 area. If there is a successful daily close below the $9,120 support, there are chances of more downsides below the $9,020 and $9,000 support levels. The next major support is near $8,920, followed by $8,780.
Looking at the chart, bitcoin is clearly trading in a bearish zone below the $9,300 resistance level. Thus, the price remains at a risk of a bearish break below $9,120 and $9,020. To move into a positive zone and start a decent upward move, the price must settle above $9,300.
Technical indicators:
Hourly MACD – The MACD is likely to move back into the bearish zone.
Hourly RSI (Relative Strength Index) – The RSI for BTC/USD is currently declining and it could test the 25 level.
Major Support Levels – $9,120 followed by $9,020.
Major Resistance Levels – $9,240, $9,300 and $9,440.


