
Reason to trust
How Our News is Made
Strict editorial policy that focuses on accuracy, relevance, and impartiality
Ad discliamer
Morbi pretium leo et nisl aliquam mollis. Quisque arcu lorem, ultricies quis pellentesque nec, ullamcorper eu odio.
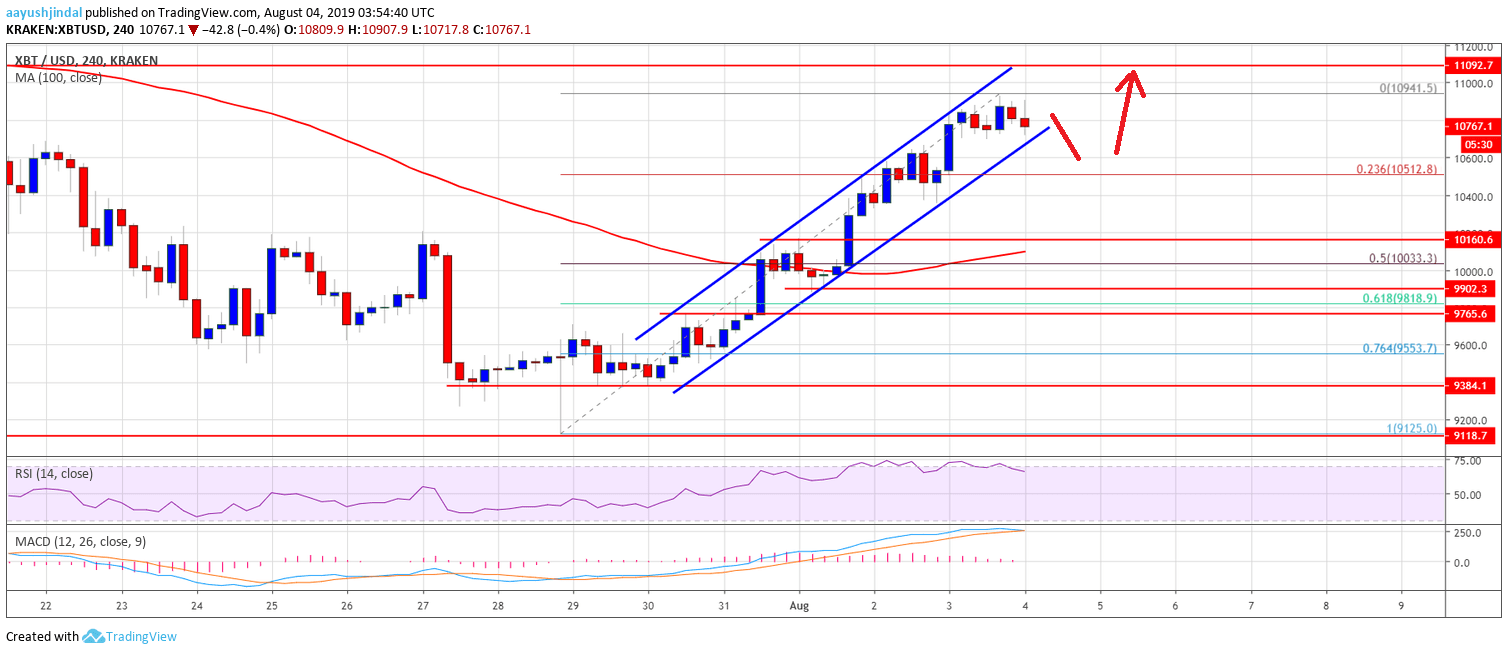
- There was a decent rise in bitcoin price above the $10,500 resistance level against the US Dollar.
- The price climbed higher and even broke the key $10,650 and $10,800 resistance levels.
- There is a major ascending channel forming with support at $10,700 on the 4-hours chart of the BTC/USD pair (data feed from Kraken).
- The pair is climbing higher and it could continue to rise above the $11,000 resistance area.
Bitcoin price is gaining momentum above $10,500 against the US Dollar. BTC price is likely to extend gains above the $11,000 and $11,200 resistance levels.
Bitcoin Price Weekly Analysis (BTC)
In the past few days, there was a steady rise in bitcoin price above the $10,200 resistance against the US Dollar. The BTC/USD pair climbed higher and gained traction above the $10,500 and $10,800 resistance levels. There was a sustained close above the $10,200 resistance and the 100 simple moving average (4-hours). A swing high was formed near $10,940 and the price is currently correcting lower.
An immediate support is near the $10.750 level. Moreover, there is a major ascending channel forming with support at $10,700 on the 4-hours chart of the BTC/USD pair. Below the channel support, the 23.6% Fib retracement level of the last upward move from the $9,125 low to $10,941 high might act as a support. Additionally, the main support is near the $10.500 level, below which there are chances of an extended decline in the near term.
The next major support is near the $10,200 and $10,000 support levels. The 50% Fib retracement level of the last upward move from the $9,125 low to $10,941 high is also likely to act as a support. Moreover, the 100 SMA is also near the $10,050 level, which is likely to act as a strong support. On the upside, there is a key resistance near the $11,000 level.
If there is an upside break above the $11,00 level, there are chances of more gains. If there is a successful close above the $11,000 resistance, the next stop for the bulls could be near the $11,200 level. Overall, any further upsides will most likely push the price towards the $11,500 and $11,650 levels.
Looking at the chart, bitcoin price is showing a lot of positive signs above the $10,200 support and the 100 SMA. Therefore, as long as the price is above the $10,200 pivot level, the price is likely to continue higher and the bulls might aim $11.2K or $11.5K.
Technical indicators
4 hours MACD – The MACD for BTC/USD is slowly moving back in the bearish zone.
4 hours RSI (Relative Strength Index) – The RSI for BTC/USD is currently correcting lower towards the 50 level.
Major Support Level – $10,500
Major Resistance Level – $11,000


