Reason to trust
How Our News is Made
Strict editorial policy that focuses on accuracy, relevance, and impartiality
Ad discliamer
Morbi pretium leo et nisl aliquam mollis. Quisque arcu lorem, ultricies quis pellentesque nec, ullamcorper eu odio.
Bitcoin price remained in a positive zone above the $39,000 level against the US Dollar. BTC is likely to climb further higher above $40,500 and $41,000.
- Bitcoin is trading nicely above the $38,200 and $38,500 support levels.
- The price is now trading well above $38,000 and the 100 hourly simple moving average.
- There is a key contracting triangle forming with resistance near $40,200 on the hourly chart of the BTC/USD pair (data feed from Kraken).
- The pair is likely to gain bullish momentum if it clears $40,200 and $40,500.
Bitcoin Price Eyes More Upsides
Bitcoin price started a fresh increase from the $36,500 support zone. BTC remained well bid above the $37,000 level and it gained pace above the $38,000 level.
The price even spiked above the $40,000 level and it settled above the 100 hourly simple moving average. A high was formed near $40,930 and the price is now consolidating gains. It corrected below the $40,000 support level.
There was a break below the 23.6% Fib retracement level of the upward move from the $36,397 swing low to $40,930 high. It is now holding the $39,000 support level. There is also a key contracting triangle forming with resistance near $40,200 on the hourly chart of the BTC/USD pair.
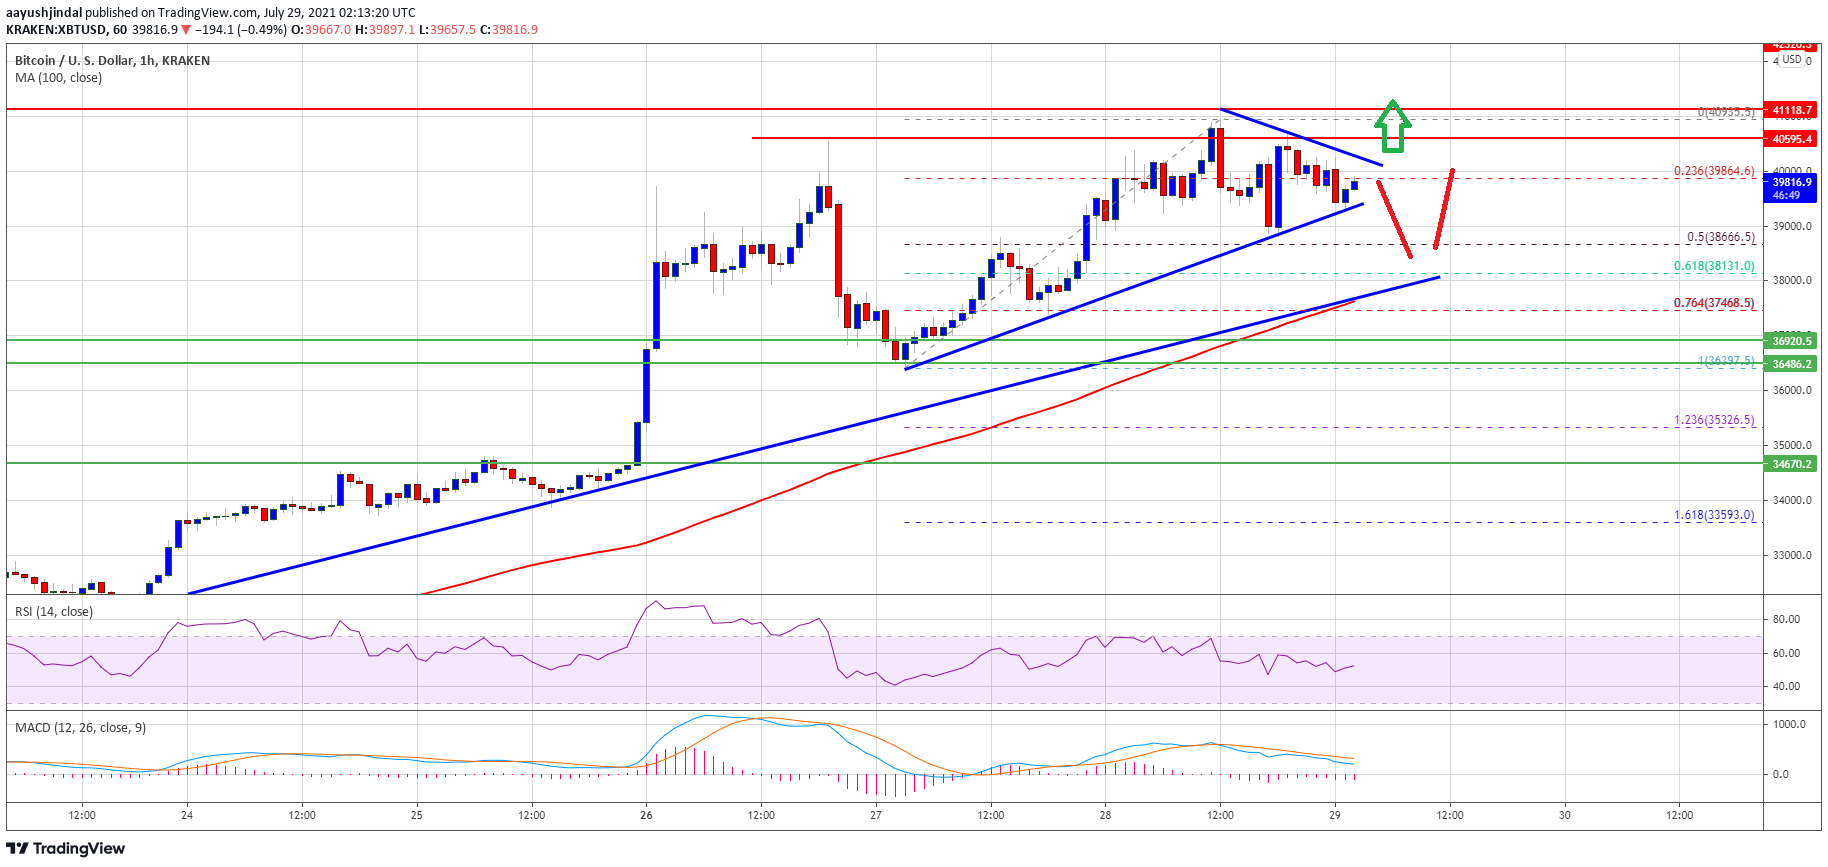
Source: BTCUSD on TradingView.com
If there is an upside break above the $40,200 resistance zone, there are chances of more upsides. The next major resistance is near the $40,800 and $41,000 levels. A close above $41,000 could trigger a steady increase towards the $42,000 level.
Dip Supported in BTC?
If bitcoin fails to climb above the $40,200 and $40,500 resistance levels, it could start another downside correction. An initial support on the downside is near the $39,400 level and the triangle lower trend line.
The first major support is now near the $38,600 zone. It is near the 50% Fib retracement level of the upward move from the $36,397 swing low to $40,930 high. A clear downside break below the $38,600 support might call for a move towards the $37,600 level. The next major support is near the $37,200 zone.
Technical indicators:
Hourly MACD – The MACD is likely to gain pace in the bullish zone.
Hourly RSI (Relative Strength Index) – The RSI for BTC/USD is now above the 50 level.
Major Support Levels – $38,600, followed by $38,000.
Major Resistance Levels – $40,200, $40,500 and $42,000.