Key Points
- Bitcoin cash price declined further and tested the $2350 support zone against the US Dollar.
- There is a major bearish trend line forming with current resistance at $2600 on the hourly chart of BCH/USD (data feed from Kraken).
- The pair has to break the trend line resistance at $2600 and the 100 hourly simple moving average to gain momentum.
Bitcoin cash price is slowly recovering above $2500 against the US Dollar. BCH/USD has to settle above $2600 and $2700 to gain traction.
Bitcoin Cash Price Resistance
There were further losses in bitcoin cash price below $2500 against the US Dollar. The price traded below the $2400 level and tested the $2350 support zone. A low was formed at $2350 from where the price started an upside move. It has gained pace above the 23.6% Fib retracement level of the last drop from the $2950 high to $2350 low.
However, BCH buyers are facing a major resistance near $2600 and $2700. There is a major bearish trend line forming with current resistance at $2600 on the hourly chart of BCH/USD. The trend line resistance is also around the 38.2% Fib retracement level of the last drop from the $2950 high to $2350 low. Above the trend line resistance, the 100 hourly simple moving average is also around $2700. Between both, the 50% Fib retracement level of the last drop from the $2950 high to $2350 low is positioned.
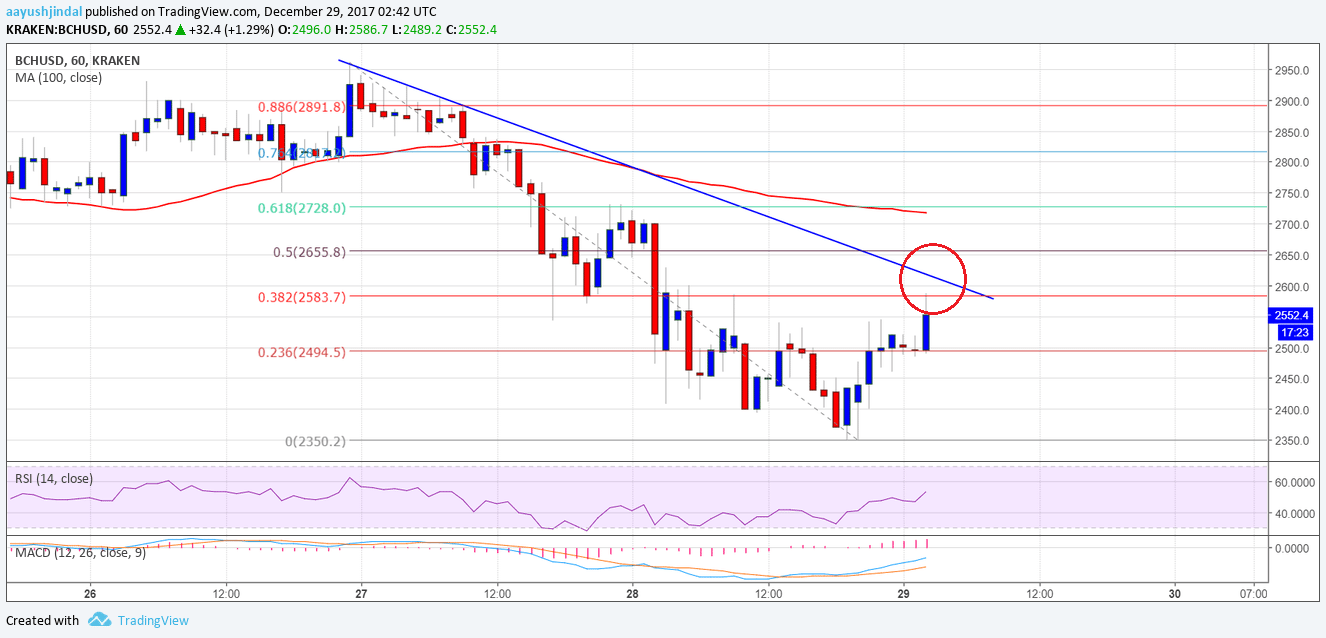
Therefore, the pair is facing a tough challenge around the $2600 and $2700 levels. It has to move above the mentioned resistance levels to gain traction toward $3000. The overall bias is positive, but a failure to gain pace above $2700 could result in a downside move.
Looking at the technical indicators:
Hourly MACD – The MACD for BCH/USD is moving nicely in the bullish zone.
Hourly RSI (Relative Strength Index) – The RSI for BCH/USD is gaining momentum above the 50 level.
Major Support Level – $2350
Major Resistance Level – $2700
Charts courtesy – Trading View, Kraken