
Reason to trust
How Our News is Made
Strict editorial policy that focuses on accuracy, relevance, and impartiality
Ad discliamer
Morbi pretium leo et nisl aliquam mollis. Quisque arcu lorem, ultricies quis pellentesque nec, ullamcorper eu odio.
Bitcoin price extended its decline below the $55,500 support zone against the US Dollar. BTC is currently recovering, but it is likely to struggle near $55,500 and $56,450.
- Bitcoin failed to clear $58,000 and it started a fresh decline below $57,000.
- The price is now trading well below $56,450 and the 100 hourly simple moving average.
- There was a break below a key contracting triangle with support near $56,800 on the hourly chart of the BTC/USD pair (data feed from Kraken).
- The pair is likely to continue lower if it fails to recover above $55,500 and $56,450.
Bitcoin Price Extends Losses
There was no clear upside break in bitcoin above the $58,000 resistance zone. As a result, BTC broke the $56,450 support zone to move into a bearish zone (as discussed in yesterday’s analysis).
The bears took control and the price even failed to stay above the $55,500 support level. There was a break below a key contracting triangle with support near $56,800 on the hourly chart of the BTC/USD pair. There was also a spike below the $54,500 support and the price tested the $53,750 support.
A low is formed near $53,786, and the price is now trading well below $56,450 and the 100 hourly simple moving average. Bitcoin is currently recovering and trading above $54,500. It cleared the 23.6% Fib retracement level of the recent decline from the $58,400 high to $53,783 low.
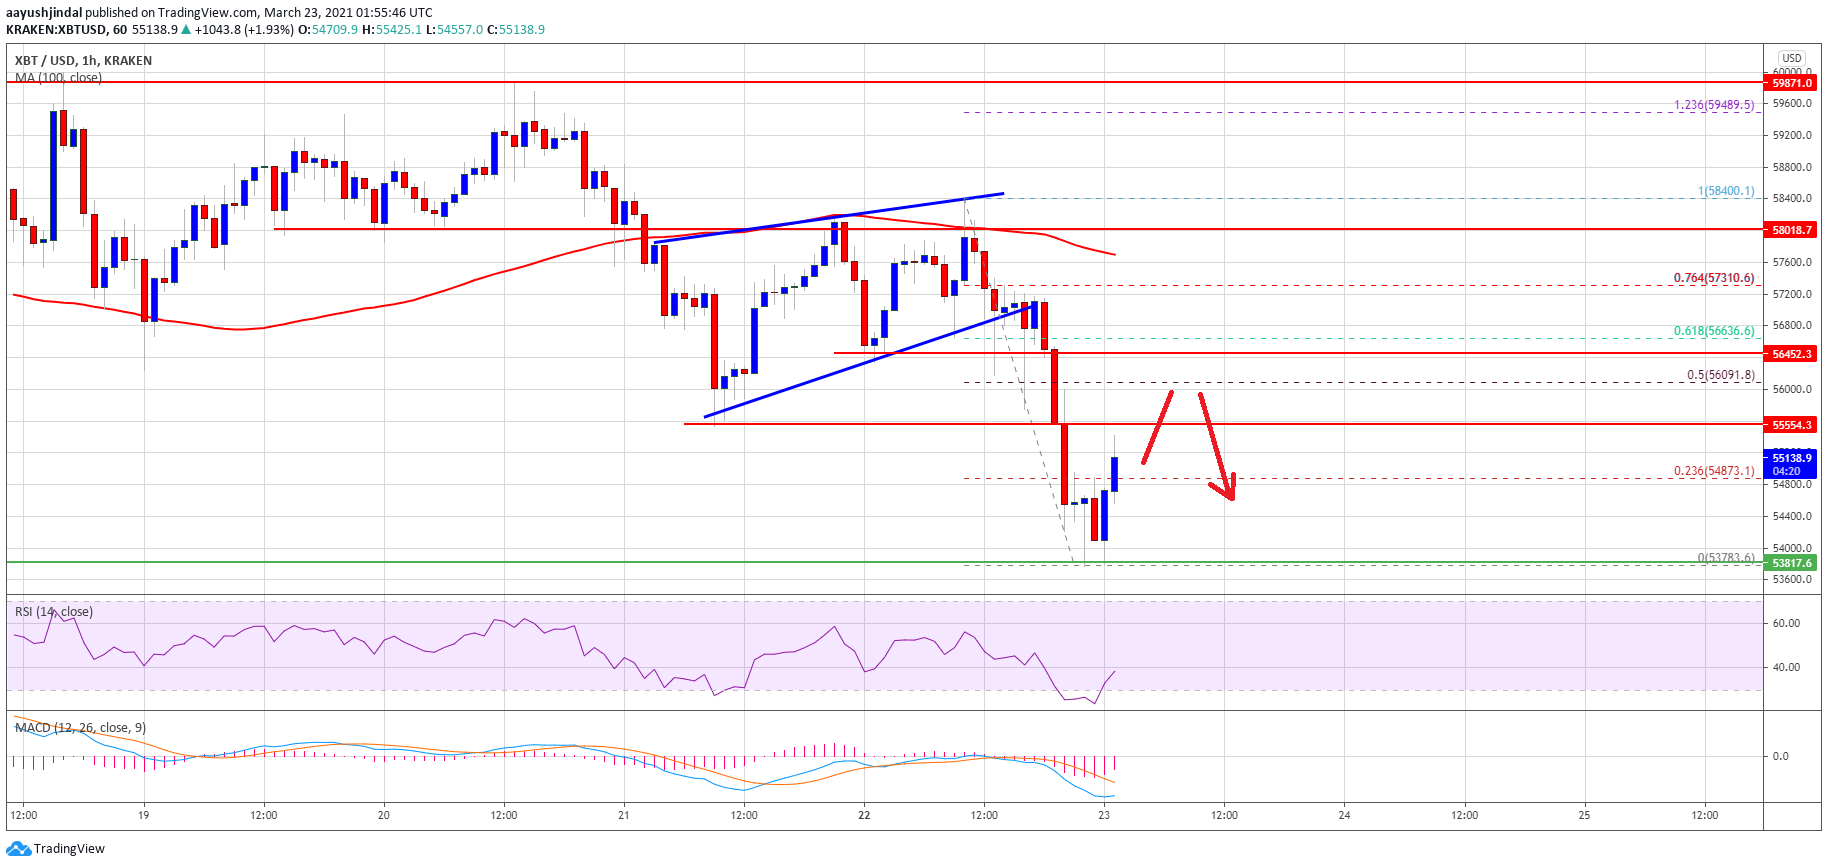
Source: BTCUSD on TradingView.com
The first major resistance is near the $55,500 level. The next major resistance is near the $56,000 level. It is close to the 50% Fib retracement level of the recent decline from the $58,400 high to $53,783 low.
The main resistance is now forming near the $56,450 level, above which the price might revisit the key $58,000 breakout resistance zone.
More Losses in BTC?
If bitcoin fails to correct higher above $55,500 and $56,000, there are chances of more downsides in the near term. An initial support is near the $54,000 level.
The key support is now near the $53,750 level, below which the bears might aim a test of the $50,000 support zone in the near term.
Technical indicators:
Hourly MACD – The MACD is losing pace in the bearish zone.
Hourly RSI (Relative Strength Index) – The RSI for BTC/USD is now below the 50 level.
Major Support Levels – $54,000, followed by $53,750.
Major Resistance Levels – $55,550, $56,000 and $56,450.


