
Reason to trust
How Our News is Made
Strict editorial policy that focuses on accuracy, relevance, and impartiality
Ad discliamer
Morbi pretium leo et nisl aliquam mollis. Quisque arcu lorem, ultricies quis pellentesque nec, ullamcorper eu odio.
Bitcoin started a steady recovery wave above $42,000 against the US Dollar. BTC tested $43,000 and the bulls might aim more upsides above $43,500.
- Bitcoin is showing positive signs above the $42,000 support zone.
- The price is trading above $42,000 and the 100 hourly simple moving average.
- There is a key bullish trend line forming with support near $42,200 on the hourly chart of the BTC/USD pair (data feed from Kraken).
- The pair might continue to recover and test the $44,000 resistance zone in the near term.
Bitcoin Price Starts Recovery
Bitcoin price formed a support base and climbed above the $42,000 resistance zone. BTC even traded above the $42,500 level and the 100 hourly simple moving average to move into a positive zone.
The upward move gained pace and the price spiked above the $43,000 level. A high is formed near $43,127 and the price is now correcting gains. It traded below the $42,800 support level. There was a move below the 23.6% Fib retracement level of the upward move from the $41,315 swing low to $43,127 high.
Besides, there is a key bullish trend line forming with support near $42,200 on the hourly chart of the BTC/USD pair. Bitcoin is now trading above $42,000 and the 100 hourly simple moving average.
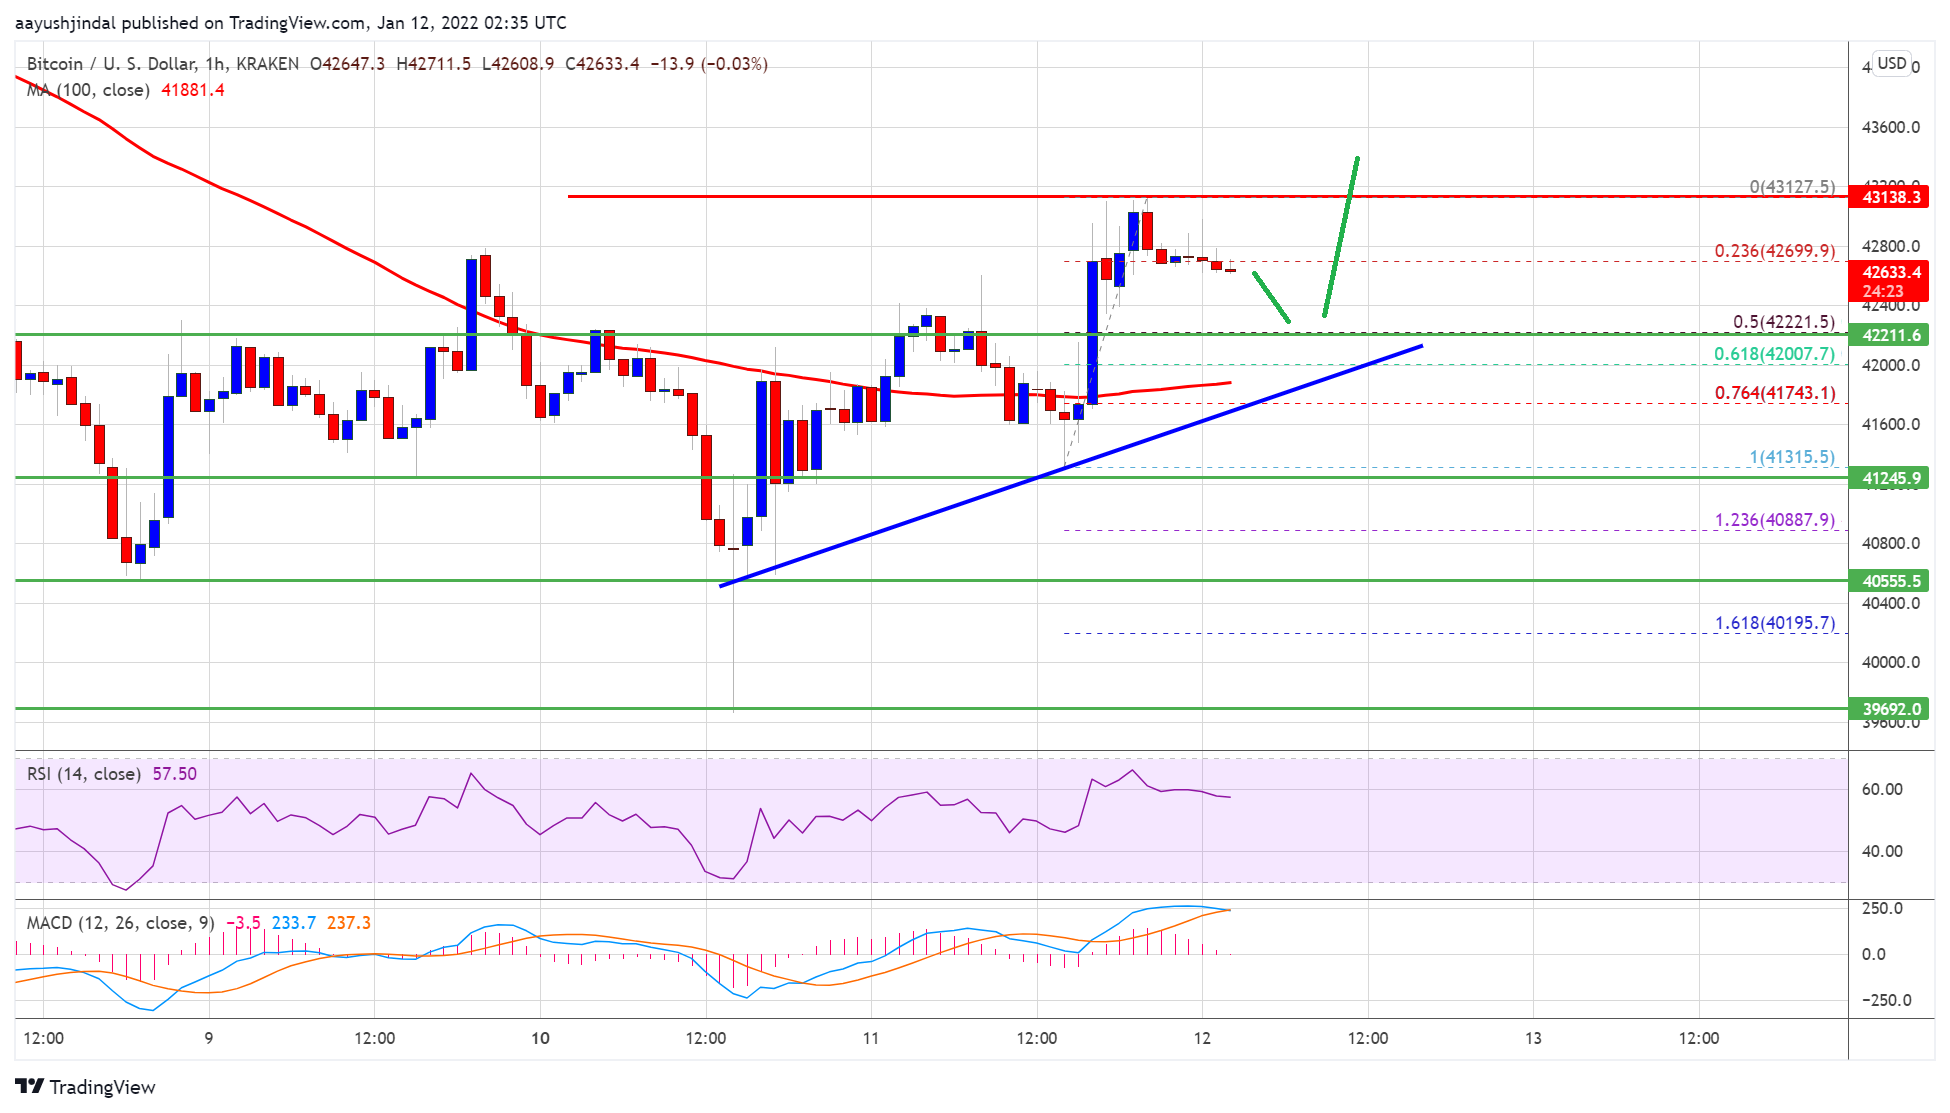
Source: BTCUSD on TradingView.com
On the upside, an initial resistance is near the $43,000 level. The next major resistance is near the $43,200 level. Any more gains could pump the price towards the $44,000 level. The next major resistance is near the $45,000 level.
Fresh Decline in BTC?
If bitcoin fails to recover above $43,000, it could start a fresh decline. An immediate support on the downside is near the $42,500 zone. The first major support is near $42,200 and the bullish trend line.
The trend line is near the 50% Fib retracement level of the upward move from the $41,315 swing low to $43,127 high. A downside break below the trend line support could lead the price towards the $41,800 level and the 100 hourly SMA. Any more losses might push the price towards the $40,500 support zone in the coming sessions.
Technical indicators:
Hourly MACD – The MACD is now losing pace in the bullish zone.
Hourly RSI (Relative Strength Index) – The RSI for BTC/USD is now above the 50 level.
Major Support Levels – $42,200, followed by $41,800.
Major Resistance Levels – $43,000, $43,200 and $44,000.


