Key Points
- Bitcoin gold price tested the $225 support and is currently moving higher against the US Dollar.
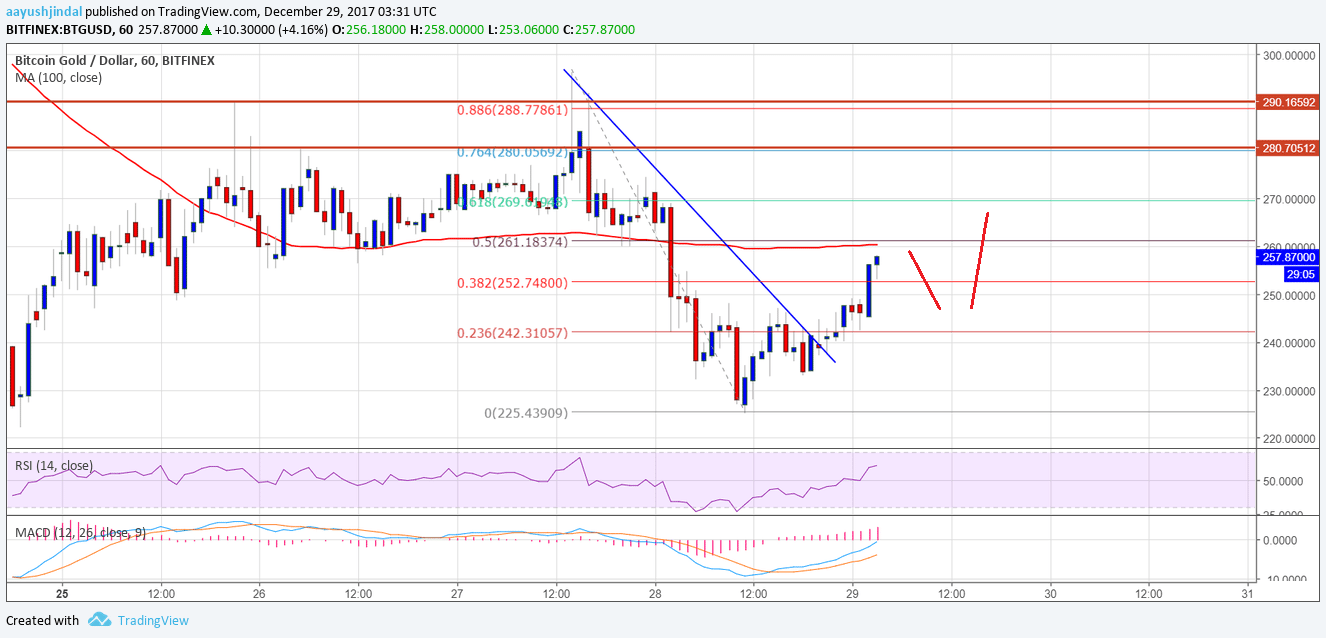
- There was a break above a major bearish trend line with resistance at $242 on the hourly chart of BTG/USD (data feed from Bitfinex).
- The pair might continue to move higher towards the $280 level in the near term.
Bitcoin gold price moved above the $240 resistance against the US Dollar. BTG/USD may soon grind higher above the 100 hourly simple moving average and $260.
Bitcoin Gold Price Trend
There was a slow and steady decline in bitcoin gold price towards the $220 level against the US Dollar. The price traded as low as $225 and later formed a base for an upside move. It started an upside move and traded above the 23.6% Fib retracement level of the last drop from the $295 high to $225 low. During the upside move, there was also a break above a major bearish trend line with resistance at $242 on the hourly chart of BTG/USD.
The pair gained pace and was able to move above the $250 resistance. At the moment, the price is trading near the 50% Fib retracement level of the last drop from the $295 high to $225 low. A break above the $260 resistance and the 100 hourly simple moving average is needed for buyers to gain traction. Once there is a break above the $260 resistance, the price could accelerate above the $280 and $290 levels. The mentioned $290 level is the next major hurdle for buyers.
On the downside, the $240 level is an initial support. However, the most important support on the downside sits near the $225 swing low.
Looking at the technical indicators:
Hourly MACD – The MACD for BTG/USD is now placed nicely in the bullish zone.
Hourly RSI (Relative Strength Index) – The RSI for BTG/USD is moving higher above the 50 level.
Major Support Level – $240
Major Resistance Level – $290
Charts courtesy – Trading View, Bitfinex