
Reason to trust
How Our News is Made
Strict editorial policy that focuses on accuracy, relevance, and impartiality
Ad discliamer
Morbi pretium leo et nisl aliquam mollis. Quisque arcu lorem, ultricies quis pellentesque nec, ullamcorper eu odio.
Bitcoin is up more than 10% and it broke the key $6,400 resistance against the US Dollar. BTC price is now trading near the $6,650 resistance, above which it could surge to $7,000.
- Bitcoin is gaining traction and it recently climbed back above $6,200 against the US Dollar.
- The price is now trading above the $6,400 level, but struggling to clear the $6,650 resistance.
- Yesterday’s major contracting triangle was breached with resistance near $6,000 on the hourly chart of the BTC/USD pair (data feed from Kraken).
- The pair is likely to continue higher if it clears the $6,600 and $6,650 resistance levels.
Bitcoin Up 10%
After forming a support base near the $5,800 level, bitcoin started a fresh increase against the US Dollar. BTC price remained well bid and it recently climbed above the $6,000 resistance area.
The upward move was convincing as yesterday’s major contracting triangle was breached with resistance near $6,000 on the hourly chart of the BTC/USD pair. The pair even climbed above the $6,400 resistance and the 100 hourly simple moving average.
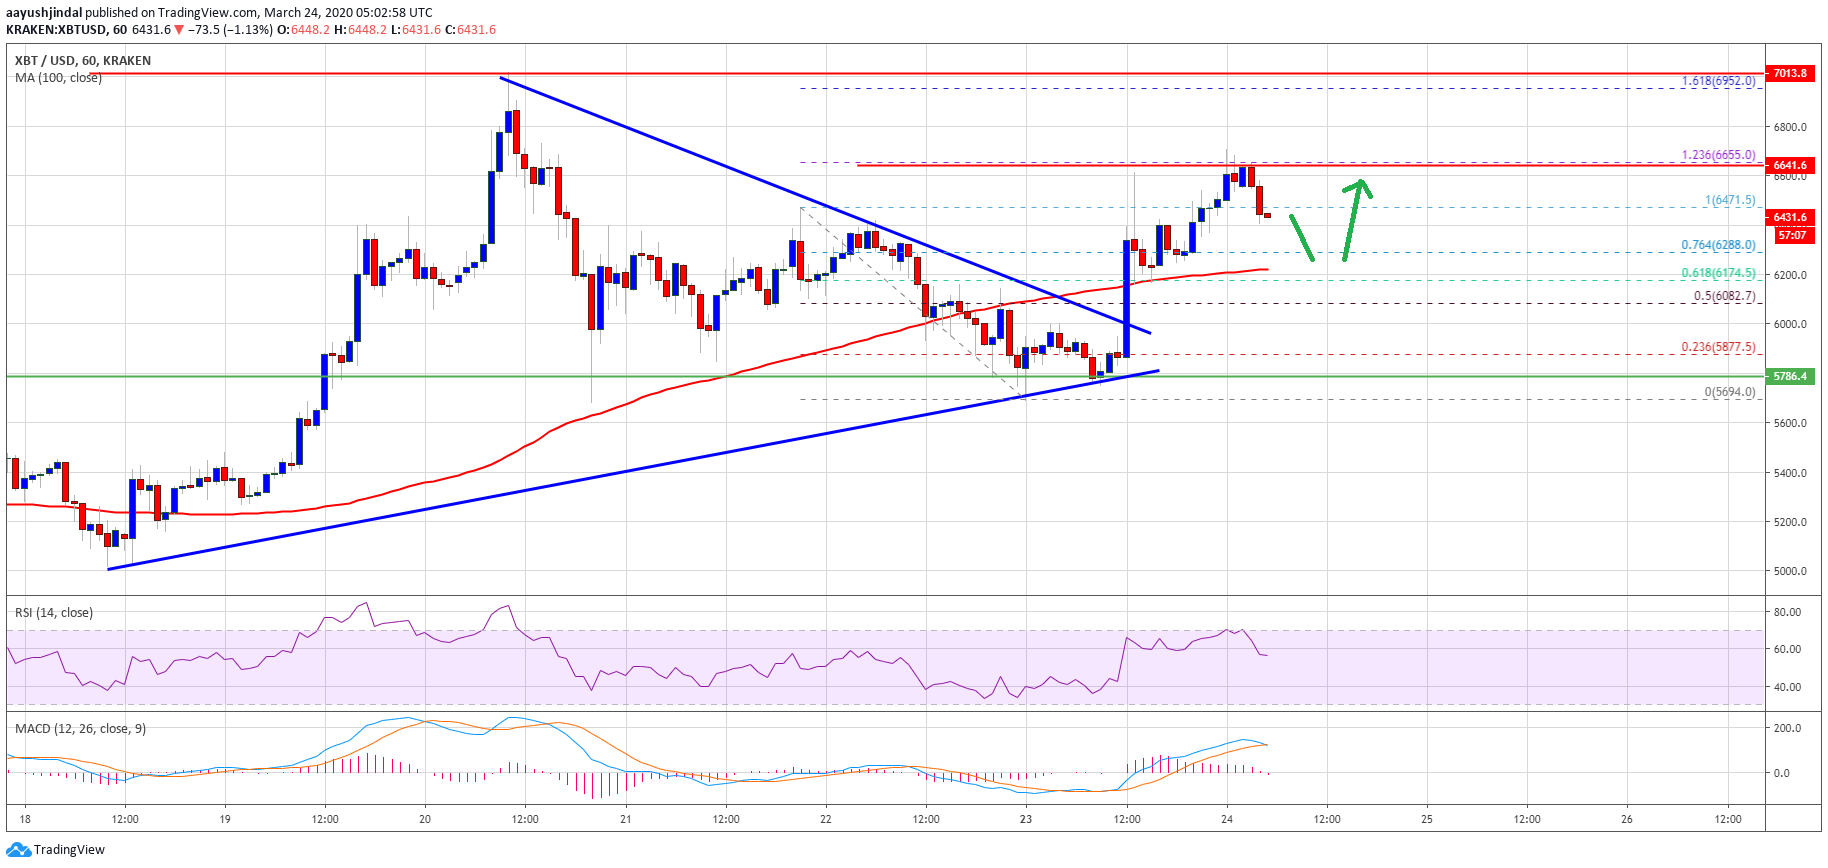
There was a clear break above the 76.4% Fib retracement level of the recent decline from the $6,471 high to $5,694 low. It opened the doors for more upsides the $6,500 resistance and the $6,471 swing high.
Bitcoin tested the 1.236 Fib extension level of the recent decline from the $6,471 high to $5,694 low. It seems like the bears are defending the key Fib extension resistance near $6,650.
If there is an upside break above the $6,650 resistance, the price could continue to rise towards the $6,952 and $7,000 resistance levels. Any further gains is likely to set the pace for a sharp rise towards $7,500.
Another Rejection?
If bitcoin fails to clear the $6,650 resistance level, it could start a fresh decline. An initial support is near the $6,450 level. The first major support is near the $6,200 level and the 100 hourly simple moving average.
If there is a downside break below the 100 hourly SMA, there is a risk of a bearish extension towards the $6,085 level. Any further losses may perhaps lead the price towards the $6,000 and $5,800 support levels in the near term.
Technical indicators:
Hourly MACD – The MACD is slowly losing momentum in the bullish zone.
Hourly RSI (Relative Strength Index) – The RSI for BTC/USD is currently correcting lower from the 65 level.
Major Support Levels – $6,200 followed by $6,000.
Major Resistance Levels – $6,650, $6,950 and $7,000.


