
Reason to trust
How Our News is Made
Strict editorial policy that focuses on accuracy, relevance, and impartiality
Ad discliamer
Morbi pretium leo et nisl aliquam mollis. Quisque arcu lorem, ultricies quis pellentesque nec, ullamcorper eu odio.
Bitcoin is up close to 4% and it broke the key $7,000 resistance zone against the US Dollar. BTC price is likely to surge towards $8,000 if it clears the $7,280-$7,300 resistance zone.
- Bitcoin remained well bid and it started a fresh increase above $7,000 against the US Dollar.
- The bears failed to push the price below the $6,750-$6,800 support zone.
- There was a break above a major bearish trend line with resistance near $7,035 on the hourly chart of the BTC/USD pair (data feed from Kraken).
- The pair is likely to accelerate towards the $8,000 level if it successfully clears the $7,280-$7,300 hurdle.
Bitcoin Showing Bullish Signs
Yesterday, bitcoin bears made a couple of attempts to push the price further lower below $6,800 against the US Dollar. They failed and it resulted in a bullish reaction in BTC above the $6,950 and $7,000 resistance levels.
The price even settled above the $7,000 level and the 100 hourly simple moving average. There was a clear break above the 50% Fib retracement level of the las key decline from the $7,295 high to $6,760 swing low.
More importantly, there was a break above a major bearish trend line with resistance near $7,035 on the hourly chart of the BTC/USD pair. The pair is now trading above the $7,100 level and approaching the $7,200 resistance.
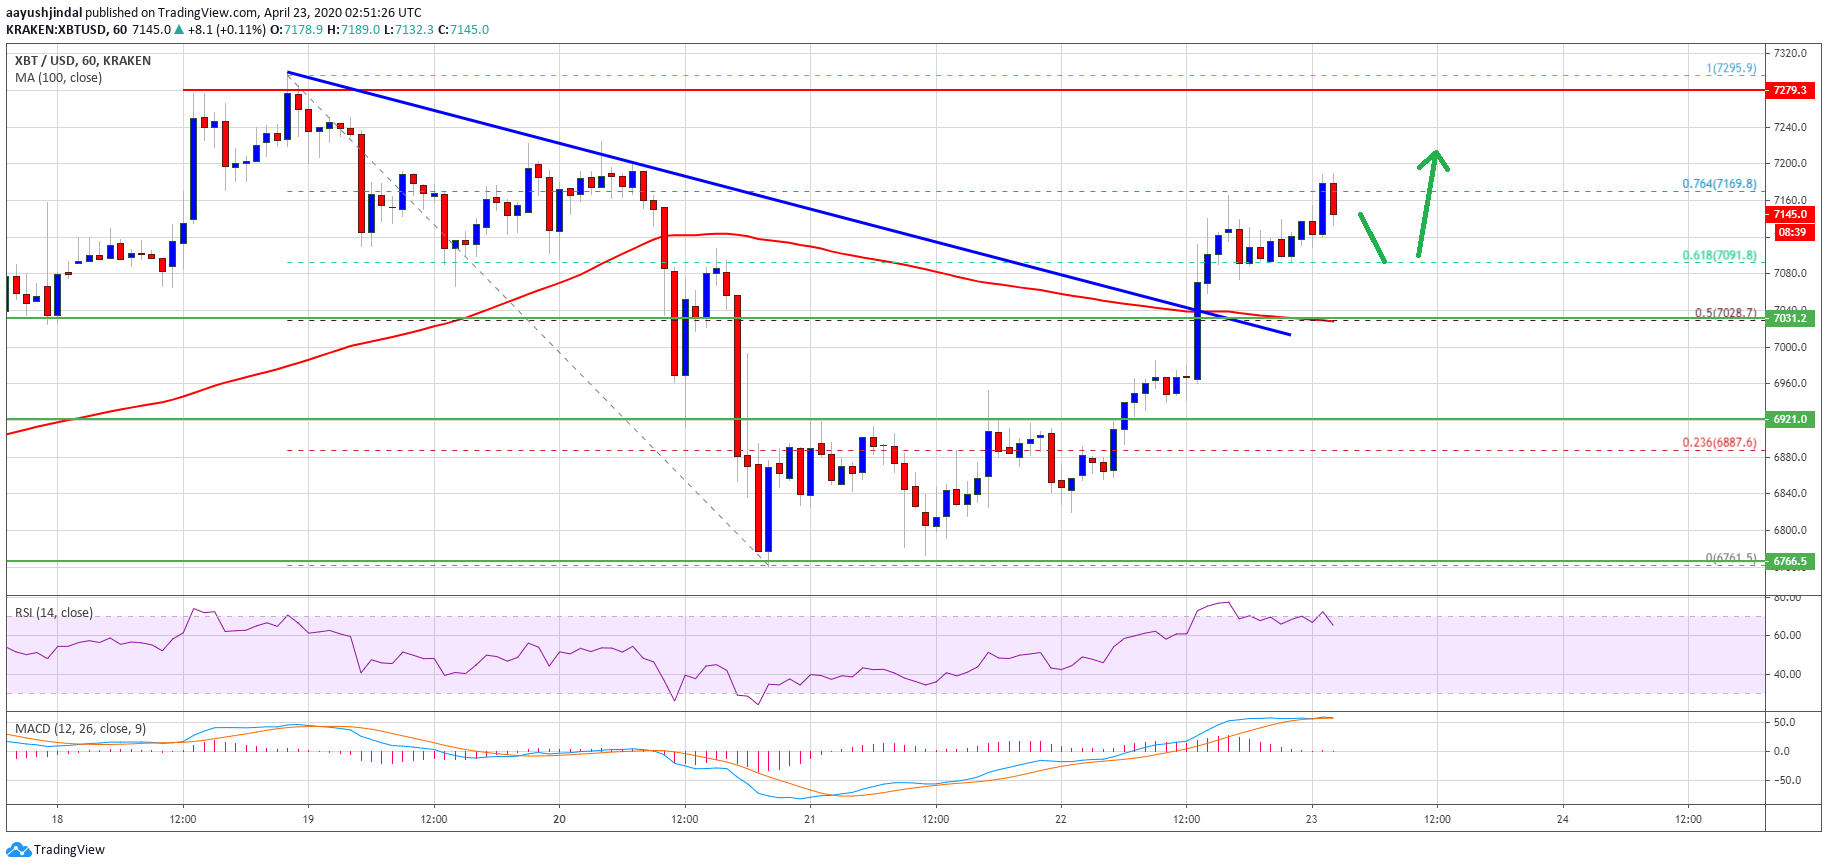
It seems like the 76.4% Fib retracement level of the las key decline from the $7,295 high to $6,760 swing low is acting as a resistance. The main resistance on the upside is near the $7,280-$7,300 region.
If bitcoin successfully clears the $7,280-$7,300 hurdle, there could be a sharp upward move. An initial resistance is near the $7,500 level, above which the bulls are likely to aim a test of the $8,000 handle in the coming sessions.
Resistance Turned Support
If bitcoin starts a downside correction, it could revisit the $7,030 and $7,000 support levels. Besides, the 100 hourly simple moving average is also near the $7,030 level to act as a strong buy zone.
Any further losses below $7,000 and the 100 hourly SMA could negate the current bullish view. In the mentioned case, the price might revisit the $6,760 swing low in the near term.
Technical indicators:
Hourly MACD – The MACD is slowly reducing its bullish zone.
Hourly RSI (Relative Strength Index) – The RSI for BTC/USD is currently correcting lower from the 70 level.
Major Support Levels – $7,030 followed by $7,000.
Major Resistance Levels – $7,200, $7,280 and $7,500.
Iimage from unsplash.


