
Reason to trust
How Our News is Made
Strict editorial policy that focuses on accuracy, relevance, and impartiality
Ad discliamer
Morbi pretium leo et nisl aliquam mollis. Quisque arcu lorem, ultricies quis pellentesque nec, ullamcorper eu odio.
Bitcoin price struggled to recover above $57,500 against the US Dollar. BTC is now declining and it remains at a risk of more downsides towards $52,000.
- Bitcoin is facing an uphill task above the $57,000 and $57,500 levels.
- The price is now trading well below the $57,000 level and the 100 hourly simple moving average.
- There is a key declining channel forming with resistance near $56,000 on the hourly chart of the BTC/USD pair (data feed from Kraken).
- The pair is likely to continue lower towards $53,000 and $52,000 in the near term.
Bitcoin Price Resumes Decline
Bitcoin started a decent recovery wave above the $55,000 resistance zone. BTC broke the $56,500 and $57,000 resistance levels.
There was a break above the 23.6% Fib retracement level of the downward move from the $63,750 swing high to $51,150 swing low. However, the bulls faced an uphill task near the $57,500 level and it also remained well below the 100 hourly simple moving average.
It seems like bitcoin was rejected near the 50% Fib retracement level of the downward move from the $63,750 swing high to $51,150 swing low. It is now trading well below the $57,000 level and the 100 hourly simple moving average.
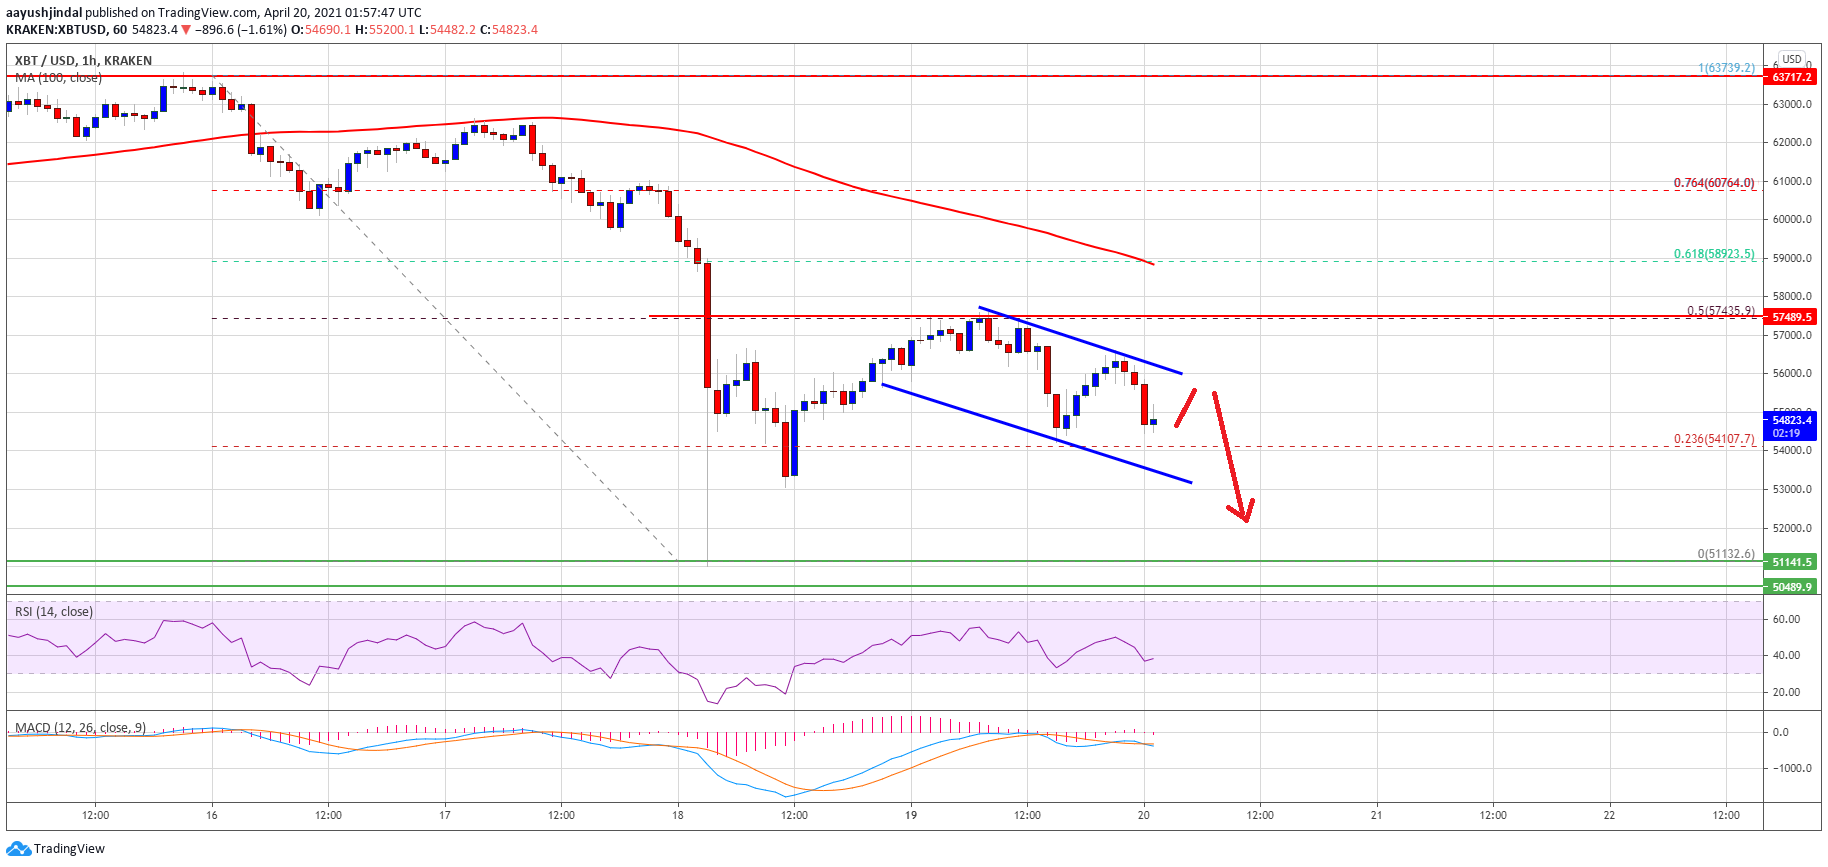
Source: BTCUSD on TradingView.com
There is also a key declining channel forming with resistance near $56,000 on the hourly chart of the BTC/USD pair. If there is a downside break below the channel support at $54,000, there is a risk of a drop towards the $53,000 support zone. The next major support is near $52,000, where the bulls might take a stand.
Upsides Capped in BTC?
If bitcoin remains stable above the $54,000 level, it could attempt an upside break. The first key resistance is near the channel trend line at $56,000.
An upside break above the channel resistance could open the doors for a move towards the $57,500 resistance. The next major hurdle for the bulls could be $58,000 or the 100 hourly simple moving average. A close above the $57,500 and $58,000 levels is must to change the current bearish bias in the near term.
Technical indicators:
Hourly MACD – The MACD is slowly gaining momentum in the bearish zone.
Hourly RSI (Relative Strength Index) – The RSI for BTC/USD is now well below the 50 level.
Major Support Levels – $54,000, followed by $52,000.
Major Resistance Levels – $56,000, $57,000 and $57,500.


