

Key Points
- Bitcoin price surged higher during the past session against the US Dollar and broke a major resistance area.
- There is a major bullish trend line formed on the hourly chart (data feed from Bitstamp), which can act as a buy zone for the bulls moving ahead.
- If the price corrects from the current levels or moves down, then one may consider buying near the $420-415 support area.
Bitcoin price is showing a lot of positive signs. If the current break in BTC/USD is not false, then more upsides are possible in the short term.
Bitcoin Price Sighting Gains?
Bitcoin price finally managed to pop higher, and the biggest positive was the fact that BTC/USD moved above a major resistance area of $420. Once the price broke the stated level, there was a spike towards $427, which clearly shows how important was the resistance zone. The price is currently correcting and moving down, but the bears have to be careful if they are planning to sell BTC versus the USD.
There is a crucial bullish trend line formed on the hourly chart (data feed from Bitstamp), which may act as an important support area and also a buy zone. The bulls may consider buying near $420-415 area as long as the price is above the trend line and support area. The stop should be an hourly close below the trend line support.
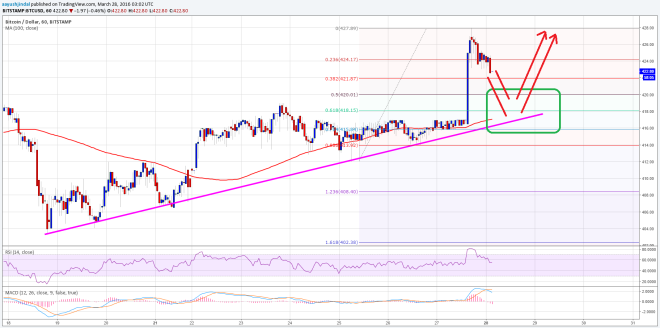

Moreover, the 50% Fib retracement level of the last wave of the $412 low to $427 high might also act as a major support area for the bulls, which is just above the highlighted trend line.
Looking at the technical indicators:
Hourly MACD – The hourly MACD is in the bearish slope, calling for a minor correction as shown the chart.
RSI (Relative Strength Index) – The RSI is above the 50 levels, suggesting the bulls are in control.
Intraday Support Level – $415
Intraday Resistance Level – $425
Charts from Bitstamp; hosted by Trading View