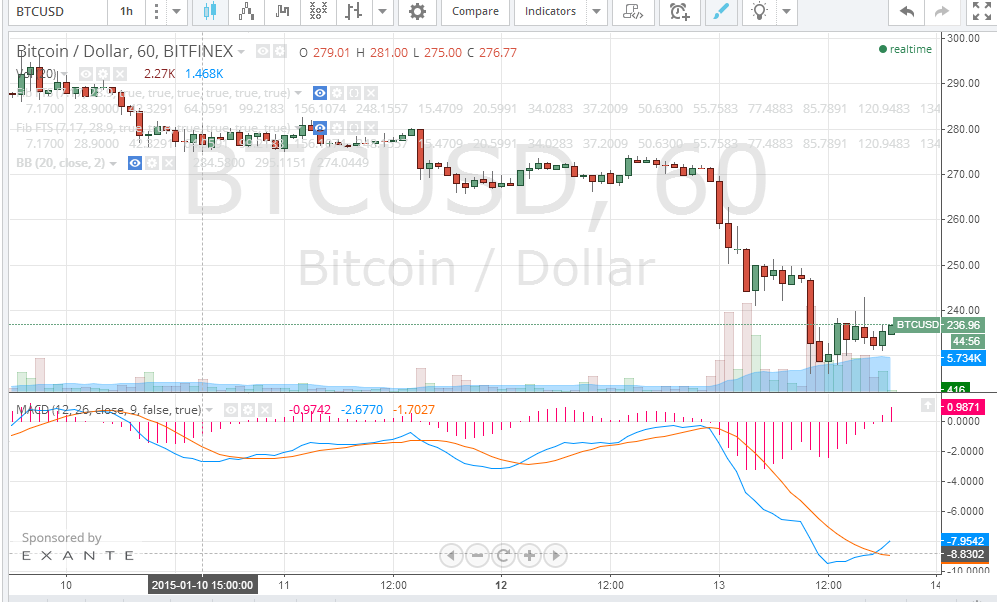
Many investors were hit hard as the price of Bitcoin dropped to $226.23 earlier today. So, as we anticipated yesterday, the downtrend is continuing, as we concluded through yesterday’s down sloping Advance/Decline line.
By observing the MACD curves for today’s one hourly charts (look at the below chart from tradingview.com), the MACD line (blue line) is below the signal line (red line), which means that the downtrend is likely to reverse shortly. As the trading volume increased today, this sign is rather important and means that the price is likely to rise shortly. However, as the price can meet no support except at the $200 mark, it won’t be surprising to see the price drop to test this support point.
By plotting the Bollinger Bands on today’s hourly charts (the 2 blue curved lines on the below chart), we can see that the 2 bands are widening the gap between them, which reflects the high volatility at the moment. However, I believe that the price of Bitcoin is going to rise shortly as shown by analyzing the charts; the “morning star” sign on the 1 hourly charts (look at the 3 candles inside the blue circle on the below chart) signals a strong buying power and predicts that the price is going to rise within less than 24 hours.
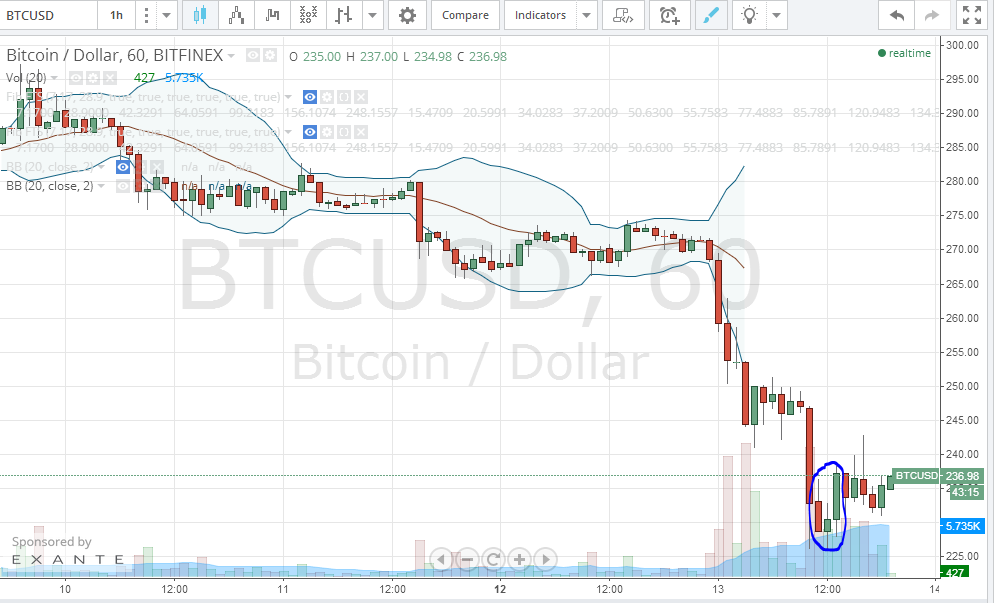
The volatility is high, but with greater risk, comes greater profits, so buying Bitcoin at a price between $225 and $230 can be profitable within a few days.