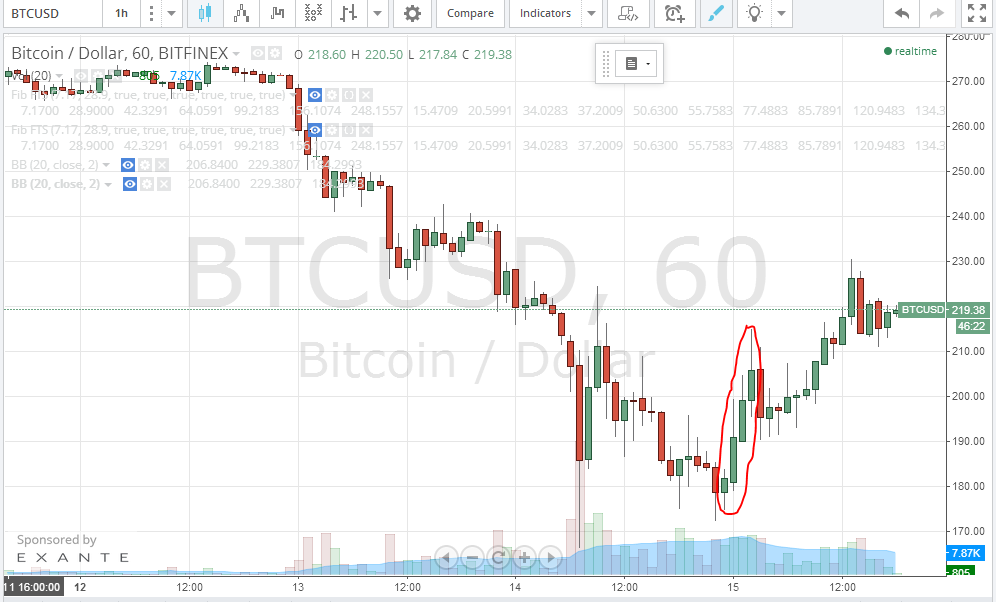
The price of Bitcoin started the day by rising and scoring higher highs above the $200 support point. The 1 hour (BTC/USD) Bitfinex chart from tradingview.com showed 4 open (green) candles before a closed (red candle was recorded (look at the candles inside the red cloud on the below chart) which, as we mentioned yesterday, is a confirmation of an intermediate degree price uptrend.
By observing the 1 day (BTC/USD) Bitfinex charts from tradingview.com, we can identify a “piercing pattern” forming as a result of today’s buying volume (the pair of candles inside the red circle on the below chart), which is an important signal that confirms an upcoming uptrend during the following few days. If the price continues to rise, it can face resistance at the $255 mark. By examining the On-balance volume (OBV) oscillator curve of the 1 daily chart (look at the below chart), we can see that the curve started to slope upwards, shortly before the price increased. An up-sloping OBV oscillator curve confirms the strength of the market’s buying power and the longevity of this new uprising trend.
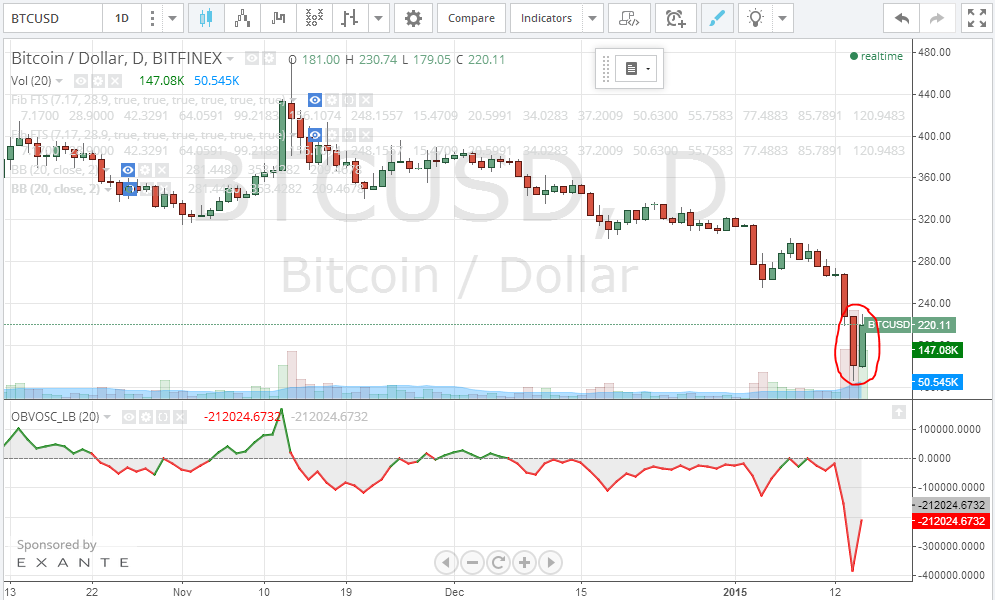
At the time of writing of this article, the price of bitcoin exceeded $223 and is expected to rise even more. Entering long between ($200-$220), you can set a take profit between ($250-$260), with a stop loss level at $180; however, always keep an eye on the OBV oscillator volume curve, as the uptrend is likely to continue so long as its curve is sloping upwards.