The price of Bitcoin started moving sideways today, after yesterday’s rise, but the buying trading volume is keeping the price well above the $200 resistance point throughout the day.
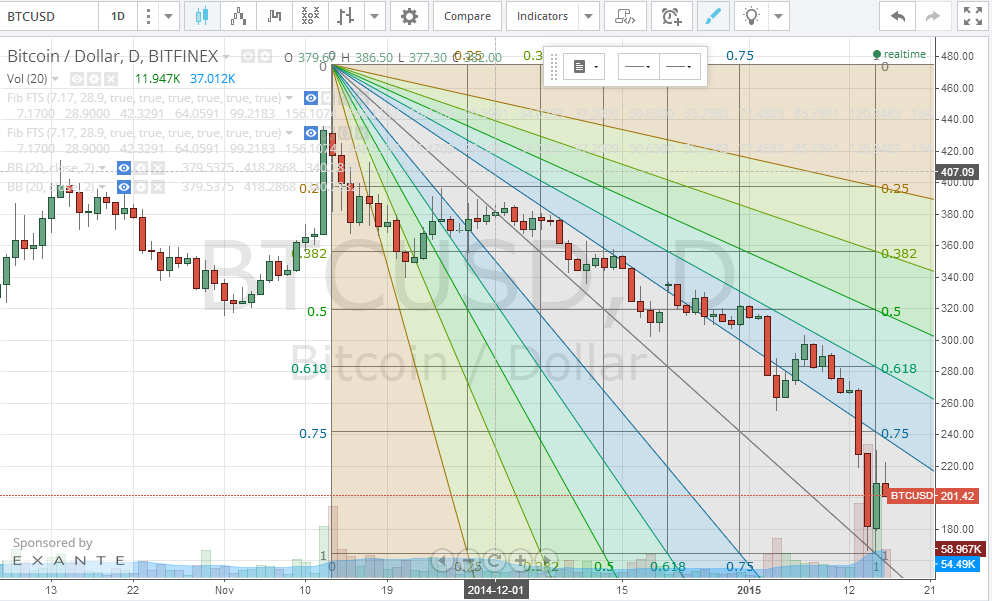
By drawing the Fibonacci retracement fan along a trend line that extends from the high recorded in November 2013 and the low recorded earlier this month (look at the below chart), we can easily identify resistance and support points at this stage.
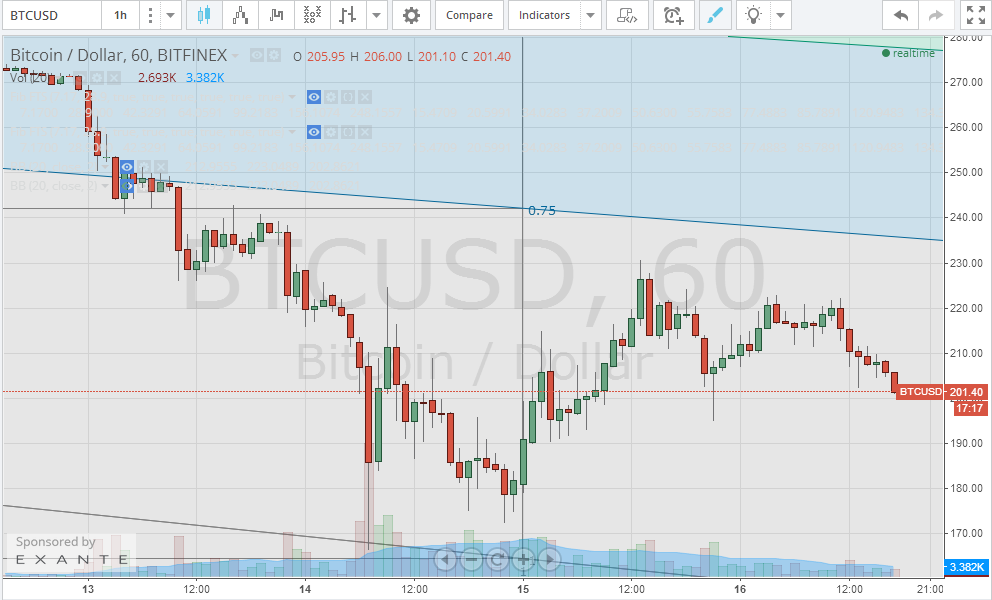
By observing the 1 hour (BTC/USD) chart from Bitfinex on tradingview.com and extending the Fibonacci fans from the 1 daily chart (look at the below chart), we can see that the 1.0 fan line serves as a support point, while the price is advancing towards the 0.75 fan line.
A bullish trend is expected to start within the next 72 hours, after the sideways movement completes correction of the price. The price will rise to test the resistance at $276 which will coincide with the 0.618 fibonacci fan line.
At the time of writing of this article, the price of Bitcoin was around $201 and is expected to bounce shortly off the $200 support line. Today’s trading volume is smaller than yesterday’s, which can be the reason why the price is moving sideways. Entering a long position trade at $200 can be set to take profit near $230 for a profitable day trade, with a stop loss at $180.