As we predicted a couple of days ago, the price of bitcoin continued to rise and reached $211 at the time of writing of this article. Our analysis for today continues on the same line of our analysis on the 16th of January, which used Fibonacci fan resistance lines to predict resistance and support lines.
By studying the Bitfinex 1 hour chart from tradingview.com (look at the below chart), we can see that the price started rising sharply about 10 hours ago and recorded a high of over $221, before declining to around $206. The fall from $221 to $206 can be viewed as a 50% correction of the bullish wave of today.
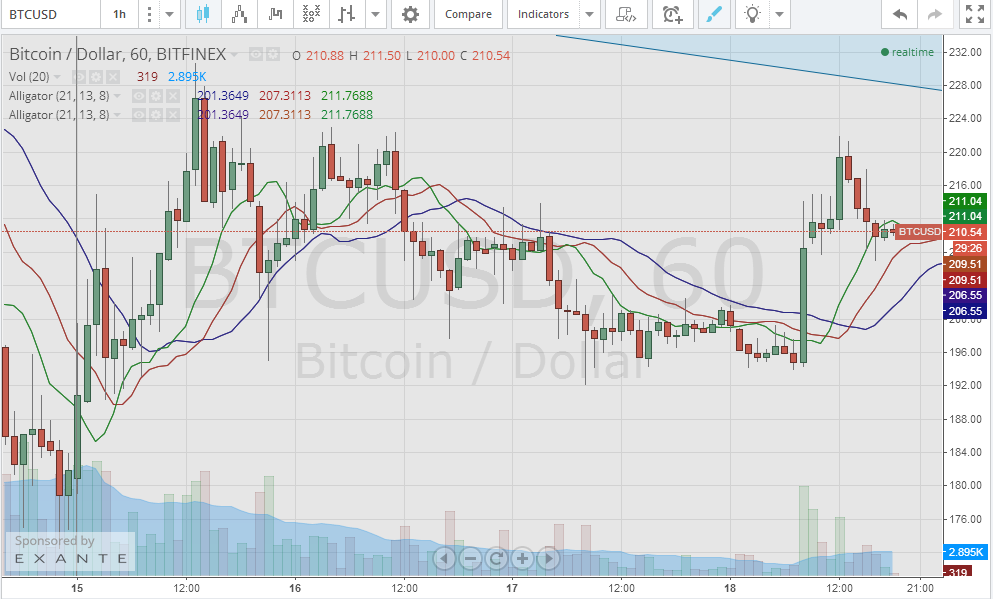
The upcoming bullish trend is confirmed by analyzing today’s trading pattern and we can see the price rising towards the $255 resistance line within the next 48 hours.
By plotting the “Vortex indicator” on the Bitfinex 1 hour charts (look at the below chart), we can see the positive trend blue indicator line crossing above the negative trend red indicator line which is a strong bullish signal that predicts an even higher rise in the price of Bitcoin during the upcoming days. We can also see the gap between the blue indicator line and the red indicator line widening, which indicates strength of the bullish trend and the buying power of the market.
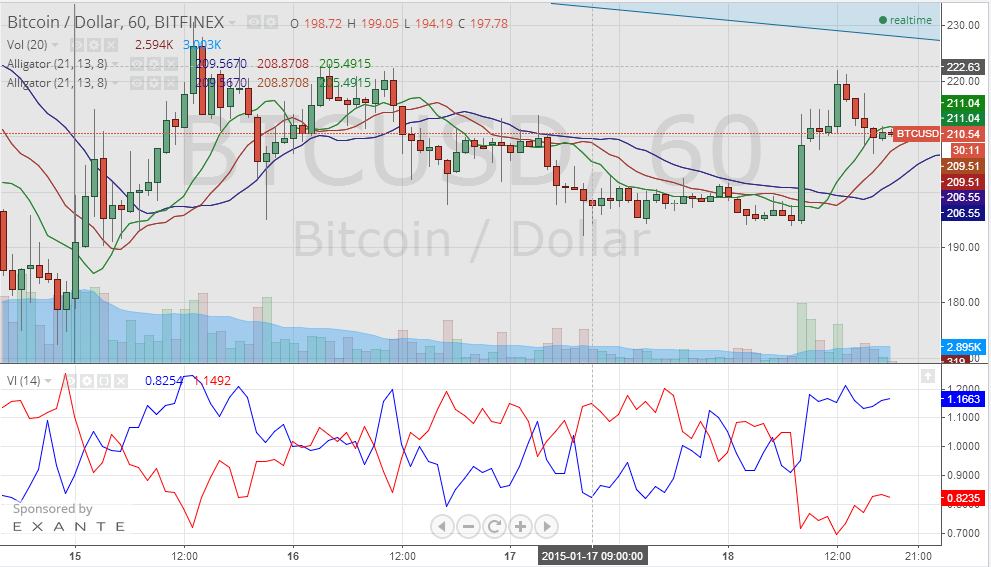
Entering long near $200 can be set with a take profit between $235 and $255 and with a stop loss at $180.