The price of bitcoin started the day by rising from $210 to around $219 and since then, it started a repetitive pattern by oscillating between $207 and around $215.
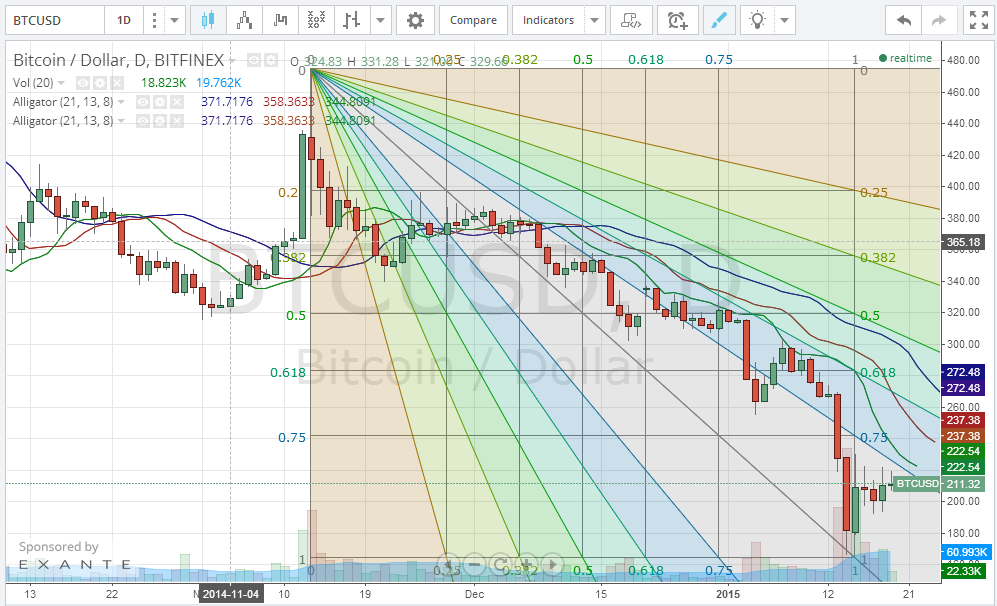
By plotting the Fibonacci retracement fan on the 1 day Bitfinex BTC/USD charts from tradingview.com (look at the below chart), we can see the price advancing towards the 0.75 fan line, while gaining support at the 1.0 fan line. Bitcoin traded around $212 at the time of writing of this article and the market seems to me moving sideways in an attempt to correct the price.
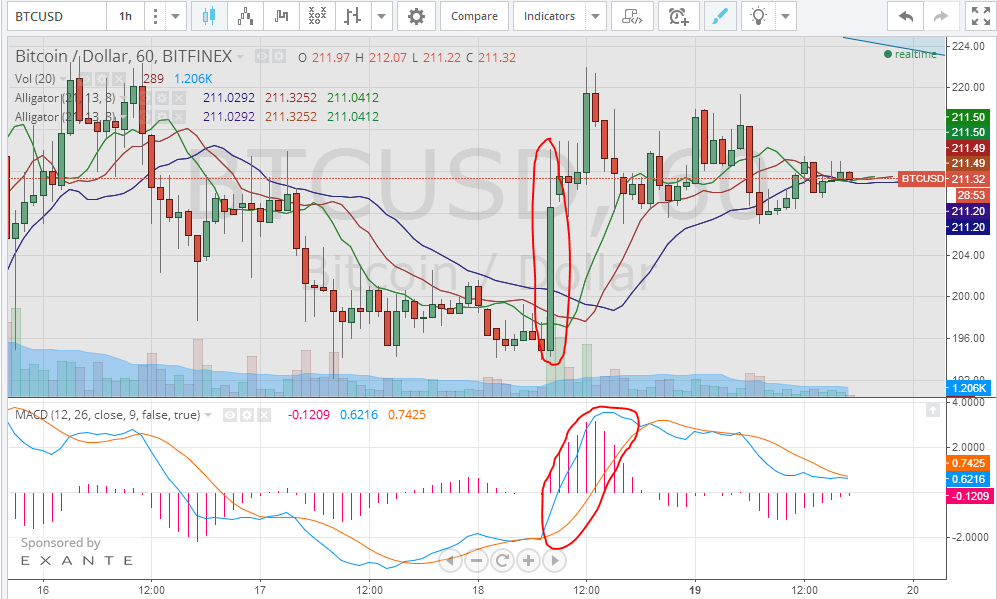
By plotting the MACD curve on the 1 hour Bitfinex (BTC/USD) charts from tradingview.com; we can see the blue MACD line crossing above the red signal line yesterday, which slightly preceded the rise from $196 to around $220. However, at the moment of writing of this article, the blue MACD line has crossed below the red signal line, which means that the bullish wave has weakened as the trading volume dropped today.
Analysis of today’s charts goes along yesterday’s analysis, as we are waiting for a bullish rally within the next 24 hours. Pay close attention to the MACD. The start of a bullish wave can be anticipated by a blue MACD line crossing over the red signal line. Also, the “vortex indicator” can be used to predict the bullish wave, when the positive blue trend line crosses over the negative red trend line, which would be a signal to increase your long positions.