The price of bitcoin continued moving sideways today, oscillating between $204 and $214. Earlier today, the price of bitcoin recorded a low of around $203, before bouncing back to $214 during the following hour.
Since the 18th of January, the price of bitcoin has been moving sideways, which reflects the market’s attempt to correct the price, yet the price will soon break out of this trend and increase as implied by the Fibonacci retracement fan plotted on the 1 day Bitcoin/USD charts (look at yesterday’s analysis).
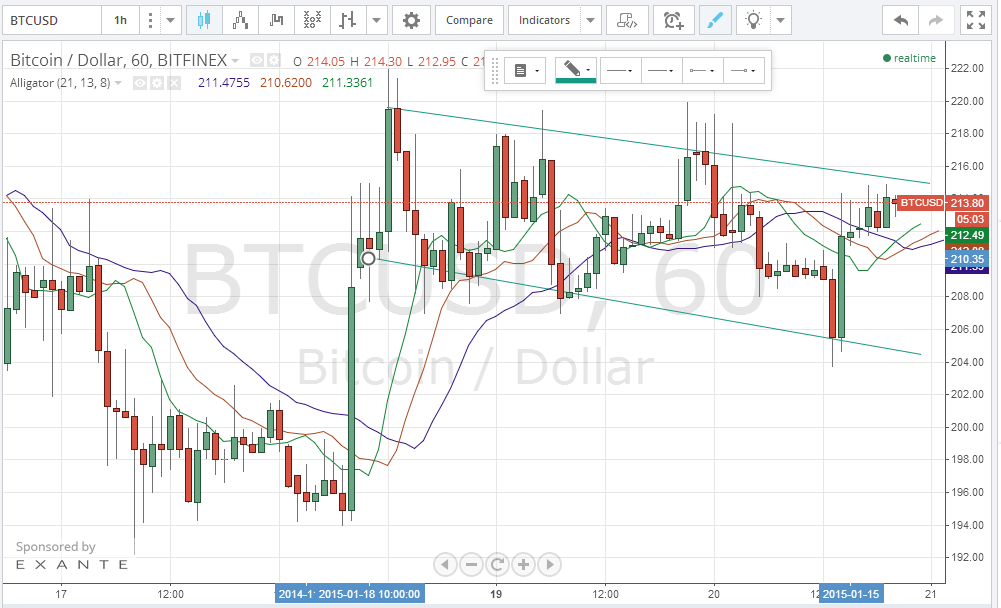
By studying the Bitfinex 1 hour Bitcoin/USD charts from tradingview.com (look at the below chart), we can see a slightly downwards sloping trend line during the past 48 hours.
By observing the Bitfinex 1 day Bitcoin/USD charts from tradingview.com (look at the below chart), we can identify a few candlestick signs that signal reversal of the New Year’s bearish trend. The blue cloud on the below chart shows 2 signs that predict an upcoming bullish trend. The first pair of candles represents a “piercing pattern” which is a strong signal that proceeded the ending of the bearish wave, as the price of bitcoin started increasing. The 2nd and 3rd candles represent a “bullish harami” which is also a significant sign that signals an upcoming bullish wave.
By studying the On-balance volume (OBV) curve of the 1 day Bitcoin/USD charts (look at the below chart), we can see that it is declining after a slight increase during the past couple of days. Keep an eye on the OBV, as it is likely to increase before a bullish wave is confirmed.
