Bitcoin Price Key Highlights
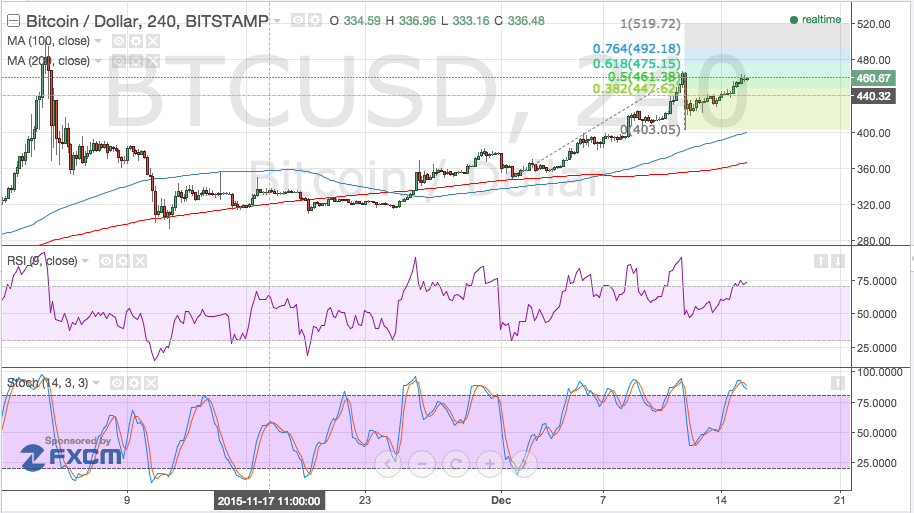
- Bitcoin’s price is regaining ground after its sharp pullback to the 100 Simple Moving Average earlier on this week.
- Using the Fibonacci extension levels on the latest correction move suggests that the Bitcoin price might even exceed its yearly highs if bulls stay in control.
Bitcoin’s price could aim for the next Fibonacci extension levels on its current rally, although market event risks could pose challenges.
USD Action on FOMC Statement
The upcoming FOMC statement is slated to be a major event risk for the US dollar, and its reaction to the announcement could spillover to other financial markets. The Fed is expected to raise borrowing costs for the first time since the 2008 recession, potentially spurring a sharp rally for the US currency.
If so, the Bitcoin price could undergo another selloff, possibly until the dynamic support levels at the moving averages. The 100 Simple Moving Average is located at the $400 mark while the 200 SMA lines up with the area of interest around $360.

Speaking of moving averages, the 100 SMA is still above the 200 SMA and moving farther away, which means that bullish momentum is still building up. However, the Relative Strength Index is making its way down from the overbought zone while the stochastic oscillator is indicating overbought conditions, so buyers might want to take a break soon.
If the Bitcoin price is able to break past its recent highs at $460-470, it could aim for the next Fibonacci extension level at $475.15 or until the 76.4% extension near $500 or the yearly highs. Stronger bullish momentum could take it up to the full extension at $520.
Profit-taking activity could also ensue before the end of the year, so Bitcoin price gains might be limited to these nearby resistance levels, paving the way for a potential selloff to the nearest floor at $400 later on.
Looking at the Indicators
Intraday support level – $400
Intraday resistance level – $480
Charts from Bitstamp, courtesy of TradingView


