Reason to trust
How Our News is Made
Strict editorial policy that focuses on accuracy, relevance, and impartiality
Ad discliamer
Morbi pretium leo et nisl aliquam mollis. Quisque arcu lorem, ultricies quis pellentesque nec, ullamcorper eu odio.
Key Points
- Bitcoin price traded higher recently and broke the $6,600 and $6,620 resistance levels against the US Dollar.
- There is a major bullish trend line in place with support at $6,550 on the hourly chart of the BTC/USD pair (data feed from Kraken).
- The pair is likely to climb higher towards the $6,650, $6,700 and $6,800 levels in the near term.
Bitcoin price is positioned nicely above $6,600 against the US Dollar. BTC/USD could accelerate gains above $6,640 to test the next resistance at $6,800.
Bitcoin Price Analysis
Yesterday, we discussed that bitcoin price seems to be preparing for the next leg either above $6,640 or below $6,460 against the US Dollar. The BTC/USD pair traded higher and broke the $6,600 and $6,620 resistance levels. There was also a break above the $6,640 level and the price settled above the 100 hourly simple moving average. It traded to a new weekly high at $6,688 and later it corrected lower.
It declined below the $6,650 level and the 23.6% Fib retracement level of the recent wave from the $6,490 low to $6,688 high. However, the downside move was protected by the $6,600 level, which was a resistance earlier. Moreover, the 50% Fib retracement level of the recent wave from the $6,490 low to $6,688 high acted provided support. There is also a connecting bullish trend line with support at $6,600 on the hourly chart of the BTC/USD pair. Below $6,600, the 100 hourly SMA could hold losses at $6,565. There is also another major bullish trend line in place with support at $6,550.
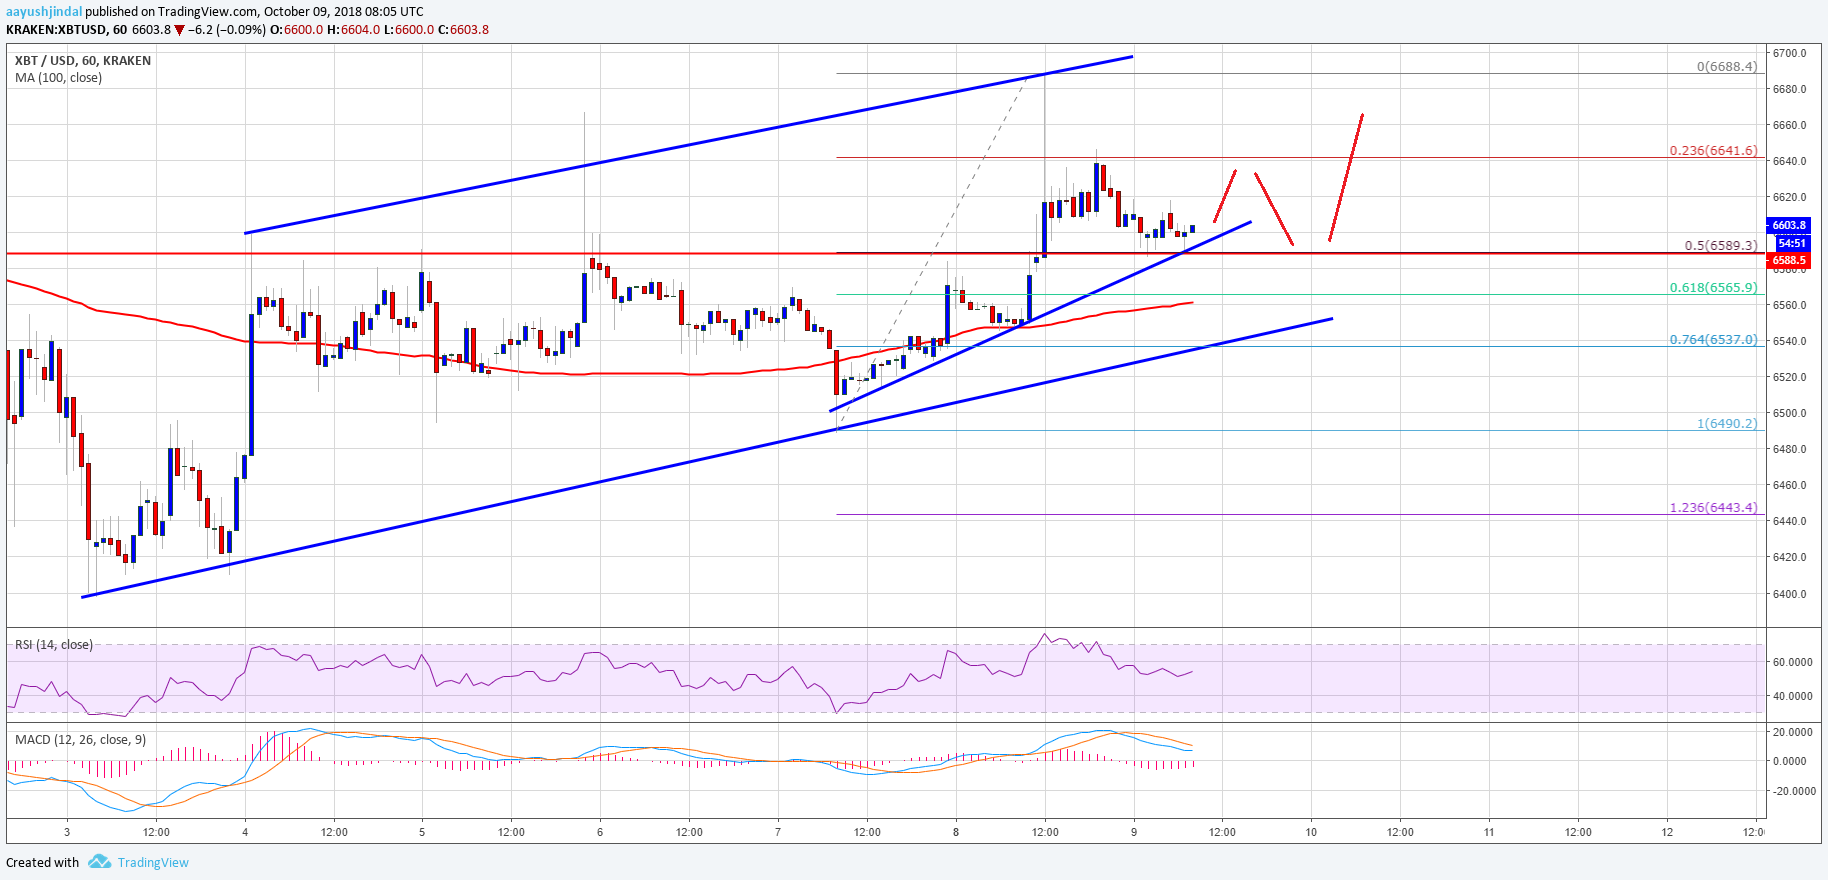
Looking at the chart, bitcoin price is positioned nicely above the $6,550 support. As long as the price is above $6,550 and the 100 hourly SMA, it could climb higher. An initial resistance is at $6,640, followed by $6,700 and the last one is at $6,800.
Looking at the technical indicators:
Hourly MACD – The MACD for BTC/USD is about to move back in the bullish zone.
Hourly RSI (Relative Strength Index) – The RSI is currently above the 50 level.
Major Support Level – $6,550
Major Resistance Level – $6,640