Action overnight in the bitcoin price was initially relatively kind to us. We managed to get some sustained run entries, and price held up and around the level we’ve been looking at for a while as key long term resistance turned support – the 1100 level. However, as the European session kicked off this morning, things changed a little. Price broke through our predefined support level and got us in short for a nice quick turnaround profit. Just as we expected it to start to reverse, however, we got another downside break, and we’re now looking at trading in and around the 1050 region – a level that we hoped we had said goodbye to for a while at the end of last week.
It doesn’t mean much from an intraday perspective. We are still going to go at price with our standard daily approach, and things are going to stay pretty tight from a risk management perspective. However, on a slightly longer term view, it’s a little less bullish.
Anyway, we’re here to put together an intraday strategy, so let’s get that sorted out and carry things through into the European afternoon session, and then we’ll take another look at things tonight to see how daily action has affected our long term bias.
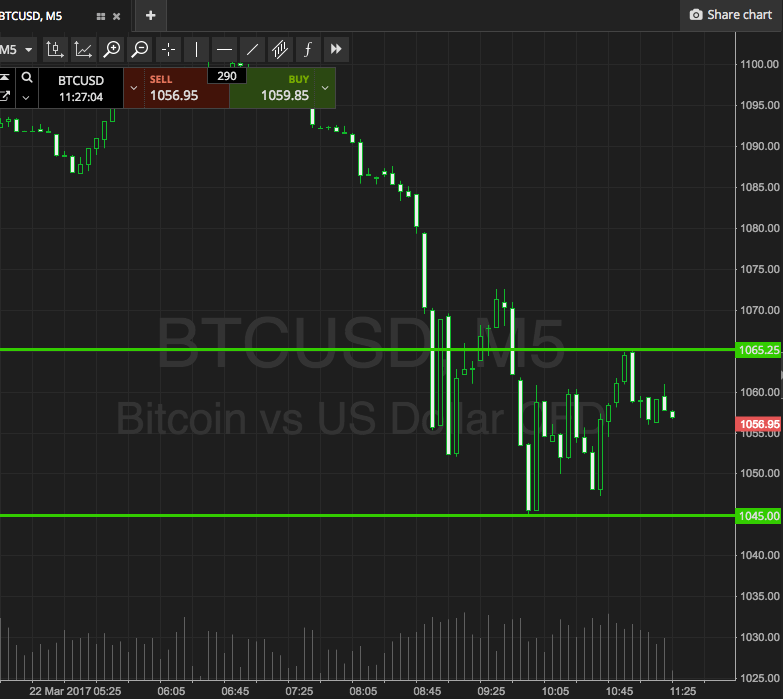
Take a look at the chart below, as ever, to get an idea of what we are focusing on this morning. It’s a five-minute candlestick chart and it’s got our key range overlaid in green.

As the chart shows, the range in focus is defined by support to the downside at 1045, and resistance to the upside at 1065. Breakout only for now, so we’ll look to get in long towards an immediate upside target of 1075 if we see a close above resistance, and a downside target of 1035 if price closes below support.
Charts courtesy of SimpleFX


