Reason to trust
How Our News is Made
Strict editorial policy that focuses on accuracy, relevance, and impartiality
Ad discliamer
Morbi pretium leo et nisl aliquam mollis. Quisque arcu lorem, ultricies quis pellentesque nec, ullamcorper eu odio.
Key Points
- Bitcoin price made a sharp downside move and traded below the $12,000 support against the US Dollar.
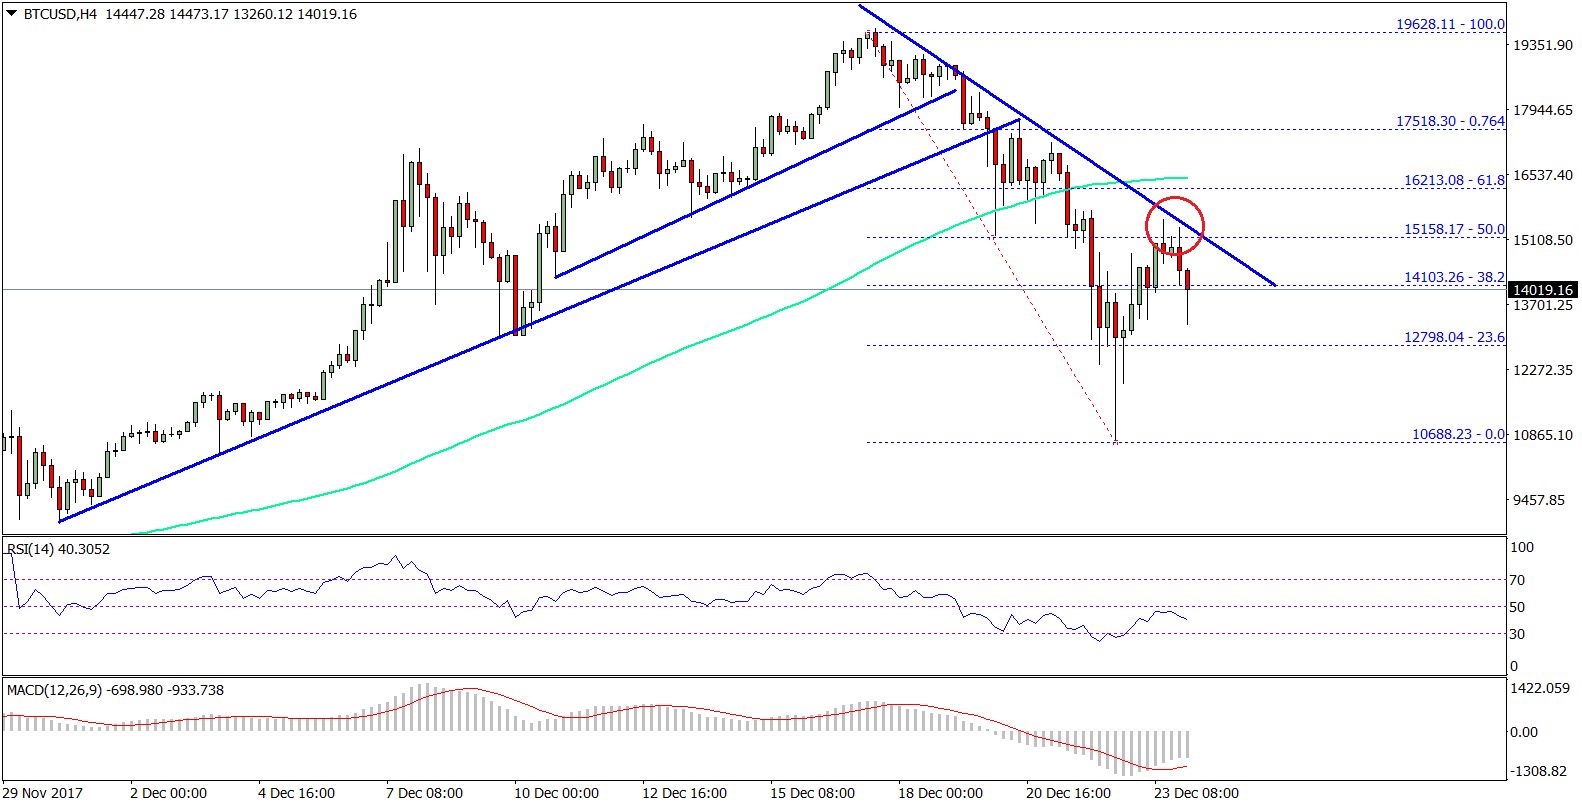
- There was a break below two important bullish trend lines with support near $17,800 on the 4-hours chart of BTC/USD (data feed from SimpleFX).
- The pair is currently recovering, but it is facing a major resistance near the $15,500 level.
Bitcoin price declined sharply toward $10,000 against the US Dollar. BTC/USD is currently recovering, but it is facing a lot of selling pressure.
Bitcoin Price Resistance
After a great upside run toward the $20,000 level, bitcoin price faced selling pressure against the US Dollar. There was a sharp decline below the $18,000 and $15,000 support levels. More importantly, there was a break below two important bullish trend lines with support near $17,800 on the 4-hours chart of BTC/USD. These trend lines break opened the doors for more losses and the pair tumbled below the $12,000 level. A low was formed at $10,688 from a minor recovery wave was initiated.
The price has moved above the 23.6% Fib retracement level of the last decline from the $19,628 high to $10,688 low. However, there is a bearish trend line forming with current resistance at $15,150 on the same chart. Moreover, the 50% Fib retracement level of the last decline from the $19,628 high to $10,688 low is also acting as a major hurdle for buyers. As long as the trend line resistance is intact, the pair might continue to struggle. Only a close above the $15,500 would negate the bearish pressure and may call for more gains.
On the flip side, if the price continues to move down, then there can be more slides toward $12,500 in the near term.
Looking at the technical indicators:
4-hours MACD – The MACD is reducing its bearish slope.
4-hours RSI (Relative Strength Index) – The RSI is struggling to move higher and is below the 50 level.
Major Support Level – $12,500
Major Resistance Level – $15,500
Charts courtesy – SimpleFX