Key Points
- Bitcoin price started traded positively against the US Dollar, and remained above a major support area of $405-08.
- There are a couple of bullish trend lines formed on the 4-hours chart of BTC/USD (data feed from Bitstamp), which may continue to act as a buy zone.
- Buying dips may be considered, but with a tight stop as any major gains are highly unlikely.
Bitcoin price may be short-term bullish against the USD. Let’s have a look at the charts and try to find out how BTC/USD can be traded moving ahead.
Bitcoin Price- Trend Lines Support
Bitcoin price continuously found bids near the $405-07 support area against the US Dollar and finally managed to trade higher. BTC traded positively against the USD and even closed above the 100 simple moving average on the 4-hours chart (data feed from Bitstamp). BTC/USD may continue to trade higher, as the bulls managed to push the price above the 50% Fib retracement level of the last drop from the $428 high to $407 low.
There are currently a couple of bullish trend lines formed on the 4-hours chart (data feed from Bitstamp), which may play a major role for Bitcoin price in the short term. As long as the price is above the trend line support, there are chances of more upsides.
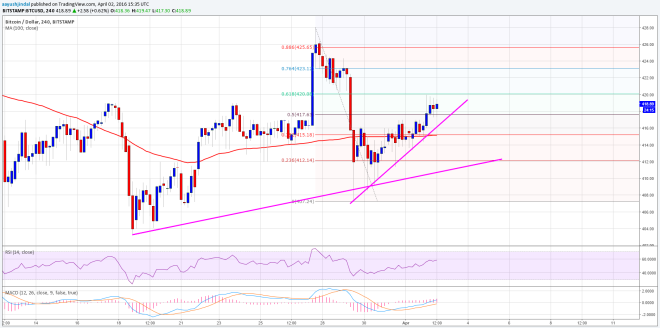

One may even consider buying, but with caution. The stop can be placed below the first trend line support and if you are looking to hold it for some time, then stop could be below the second trend line support. On the upside, a test of $428 is possible, followed by $430.
Looking at the technical indicators:
4-hours MACD – The MACD is in the bullish zone, which is a positive sign for the bulls.
4-hours RSI (Relative Strength Index) – The RSI is also above the 50 level, pointing towards more gains.
Major Support Level – $415
Major Resistance Level – $425
Charts from Bitstamp; hosted by Trading View