Reason to trust
How Our News is Made
Strict editorial policy that focuses on accuracy, relevance, and impartiality
Ad discliamer
Morbi pretium leo et nisl aliquam mollis. Quisque arcu lorem, ultricies quis pellentesque nec, ullamcorper eu odio.
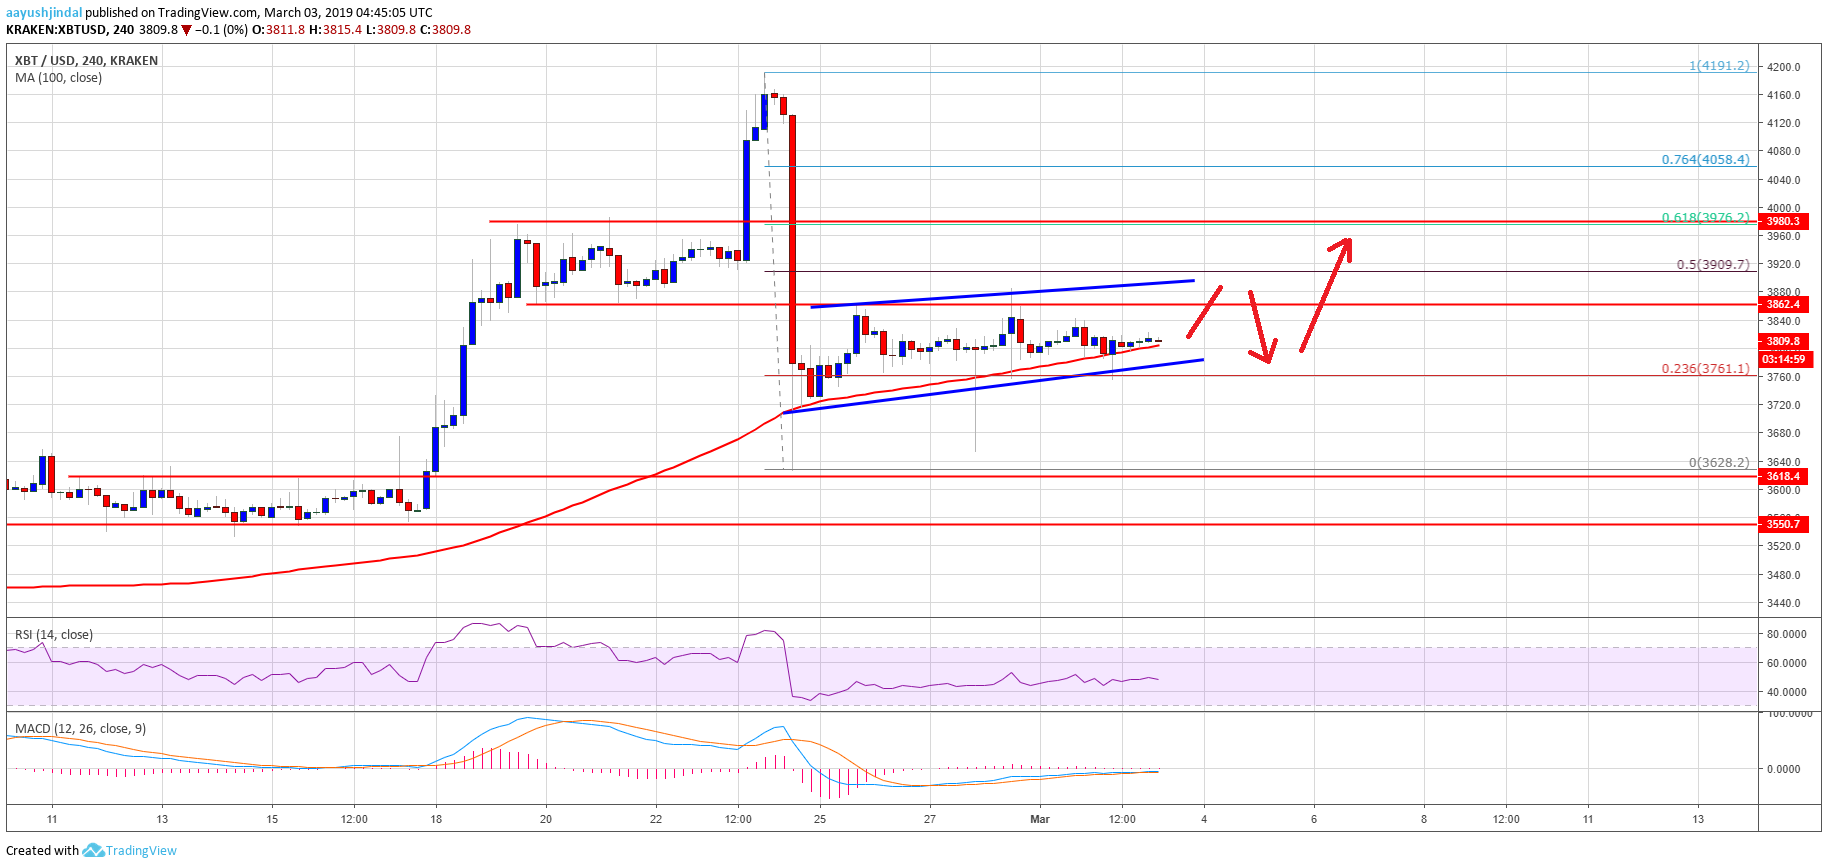
- Bitcoin price corrected lower sharply after trading towards the $4,200 resistance against the US Dollar.
- The price declined below the $3,860 support area and tested the $3,620 support zone.
- There is a short term ascending channel or bear flag formed with resistance at $3,900 on the 4-hours chart of the BTC/USD pair (data feed from Kraken).
- The pair could slowly move higher as long as it is above the $3,760 and $3,720 supports.
Bitcoin price started consolidating losses below $3,860 against the US Dollar. BTC/USD could rise again as long as there is no daily close below the $3,720 support level in the near term.
Bitcoin Price Analysis
After a sharp rally above the $4,000 level, bitcoin price faced sellers near the $4,190-4,200 zone against the US Dollar. The BTC/USD pair declined heavily and broke the $4,000 and $3,860 support levels. There was a close below the $3,860 support and the price spiked below the $3,650 support level. It traded close to the $3,620 support level and recovered later. More importantly, there was no close below the $3,720 support and the 100 simple moving average (4-hours).
The last swing low was formed at $3,628 and the price climbed above $3,760. It broke the 23.6% Fib retracement level of the last decline from the $4,191 high to $3,628 low. There was a proper close above the $3,760 level and the 100 simple moving average (4-hours). However, the price struggled to break the key $3,860 resistance (the previous main support). At the outset, there is a short term ascending channel or bear flag formed with resistance at $3,900 on the 4-hours chart of the BTC/USD pair.
The pair could slowly move higher towards the channel resistance and $3,890. The 50% Fib retracement level of the last decline from the $4,191 high to $3,628 low is also near the channel resistance. Therefore, it won’t be easy for buyers to clear the $3,900-3,910 resistance area. If there is a proper close above $3,900, the price may rally towards the $4,000 barrier. On the downside, an initial support is at $3,760 and 100 simple moving average (4-hours). If there is a daily close below the $3,720 support, the price could move into a bearish zone towards $3,620 and $3,560.
Looking at the chart, BTC price seems to be consolidating below the key $3,860 and $3,900 resistance. Until the price is below $3,900, there is a risk of another drop. Therefore, buyers seem to be cautiously bullish, but it might change if the price closes below $3,720.
Technical indicators
4 hours MACD – The MACD for BTC/USD is slightly in the bullish zone.
4 hours RSI (Relative Strength Index) – The RSI for BTC/USD is currently flat near the 50 level.
Major Support Level – $3,720
Major Resistance Level – $3,900