
Reason to trust
How Our News is Made
Strict editorial policy that focuses on accuracy, relevance, and impartiality
Ad discliamer
Morbi pretium leo et nisl aliquam mollis. Quisque arcu lorem, ultricies quis pellentesque nec, ullamcorper eu odio.
Bitcoin price started a fresh increase from the $32,250 support zone against the US Dollar. BTC must settle above the $35,000 resistance to move further into a bullish zone.
- Bitcoin started a fresh increase above the $33,500 and $34,000 resistance levels.
- The price is now trading above the $34,000 support and the 100 hourly simple moving average.
- There is a major bullish trend line forming with support near $34,000 on the hourly chart of the BTC/USD pair (data feed from Kraken).
- The pair is likely to continue higher above the $35,000 resistance unless it fails to stay above $33,500.
Bitcoin Price Starts Fresh Increase
Bitcoin formed a decent support base above the $32,000 zone and started a fresh increase. BTC broke the $33,500 resistance zone and the 100 hourly simple moving average.
It even surpassed the $34,000 resistance to move into a positive zone. However, the price is still struggling to surpass the main $35,000 resistance zone. A high is formed near $34,600 and the price is now correcting gains.
It traded below the $34,200 level. There was also a break below the 23.6% Fib retracement level of the upward move from the $32,988 swing low to $34,609 high. On the downside, an initial support is seen near the $34,000 level.
There is also a major bullish trend line forming with support near $34,000 on the hourly chart of the BTC/USD pair. The next support is near the $33,800 level. It is close to the 50% Fib retracement level of the upward move from the $32,988 swing low to $34,609 high.
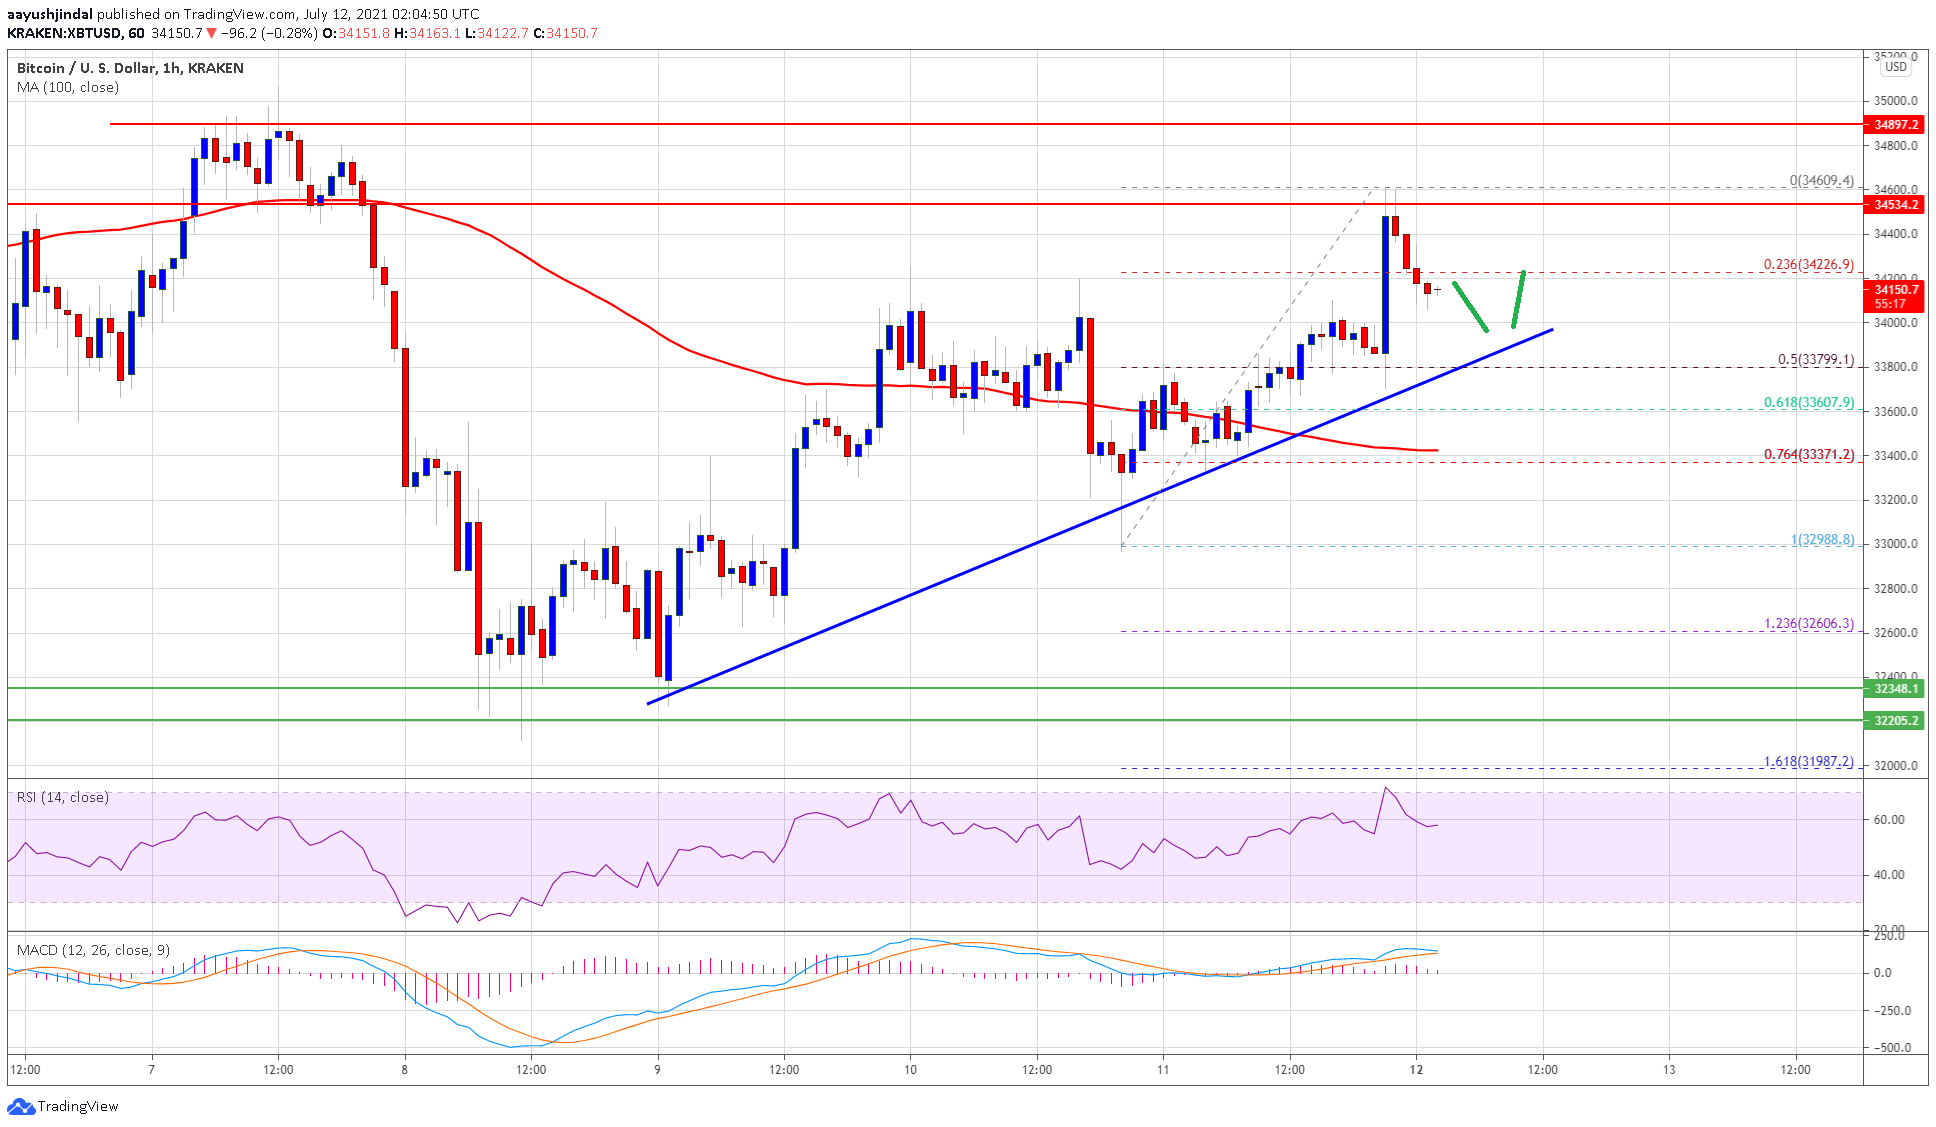
Source: BTCUSD on TradingView.com
The main support is now forming near the $33,500 zone and the 100 hourly SMA. Any more losses might push the price back into a negative zone.
More Upsides in BTC?
If bitcoin remains stable above the $33,500 support zone, it could continue to move higher. An immediate resistance on the upside is near the $34,500 level.
The first major resistance is near $35,000. If there is a close above the $35,000 resistance zone, the price could rise towards the $36,500 resistance. The next major hurdle is near the $38,000 zone.
Technical indicators:
Hourly MACD – The MACD is now losing pace in the bullish zone.
Hourly RSI (Relative Strength Index) – The RSI for BTC/USD is now well above the 50 level.
Major Support Levels – $34,000, followed by $33,500.
Major Resistance Levels – $34,500, $35,000 and $36,500.


