Reason to trust
How Our News is Made
Strict editorial policy that focuses on accuracy, relevance, and impartiality
Ad discliamer
Morbi pretium leo et nisl aliquam mollis. Quisque arcu lorem, ultricies quis pellentesque nec, ullamcorper eu odio.
Bitcoin price settled below the $12,000 support level against the US Dollar. BTC is currently consolidating above the $11,650 and $11,500 support levels, below which it could nosedive.
- Bitcoin remained in a short-term bearish zone and it settled below the $12,000 region.
- The price is currently consolidating losses above the $11,650 and $11,550 support levels.
- There is a key bearish trend line forming with resistance near $11,880 on the hourly chart of the BTC/USD pair (data feed from Kraken).
- The pair must stay above the $11,500 support zone to start a fresh increase in the near term.
Bitcoin Price Showing Bearish Signs
After bitcoin started a downside correction below $12,000, the bulls slowly lost control against the US Dollar. BTC even settled well below the $12,000 region and the 100 hourly simple moving average.
The bears were able to push the price below the $11,650 support zone. However, the price is still trading nicely above the $11,550 and $11,500 support levels. A low is formed near $11,581 and the price is currently correcting higher.
It recovered above the $11,700 level, but the $11,800 level is acting as a resistance. The 23.6% Fib retracement level of the recent drop from the $12,490 high to $11,581 low is also near the $11,795 level.
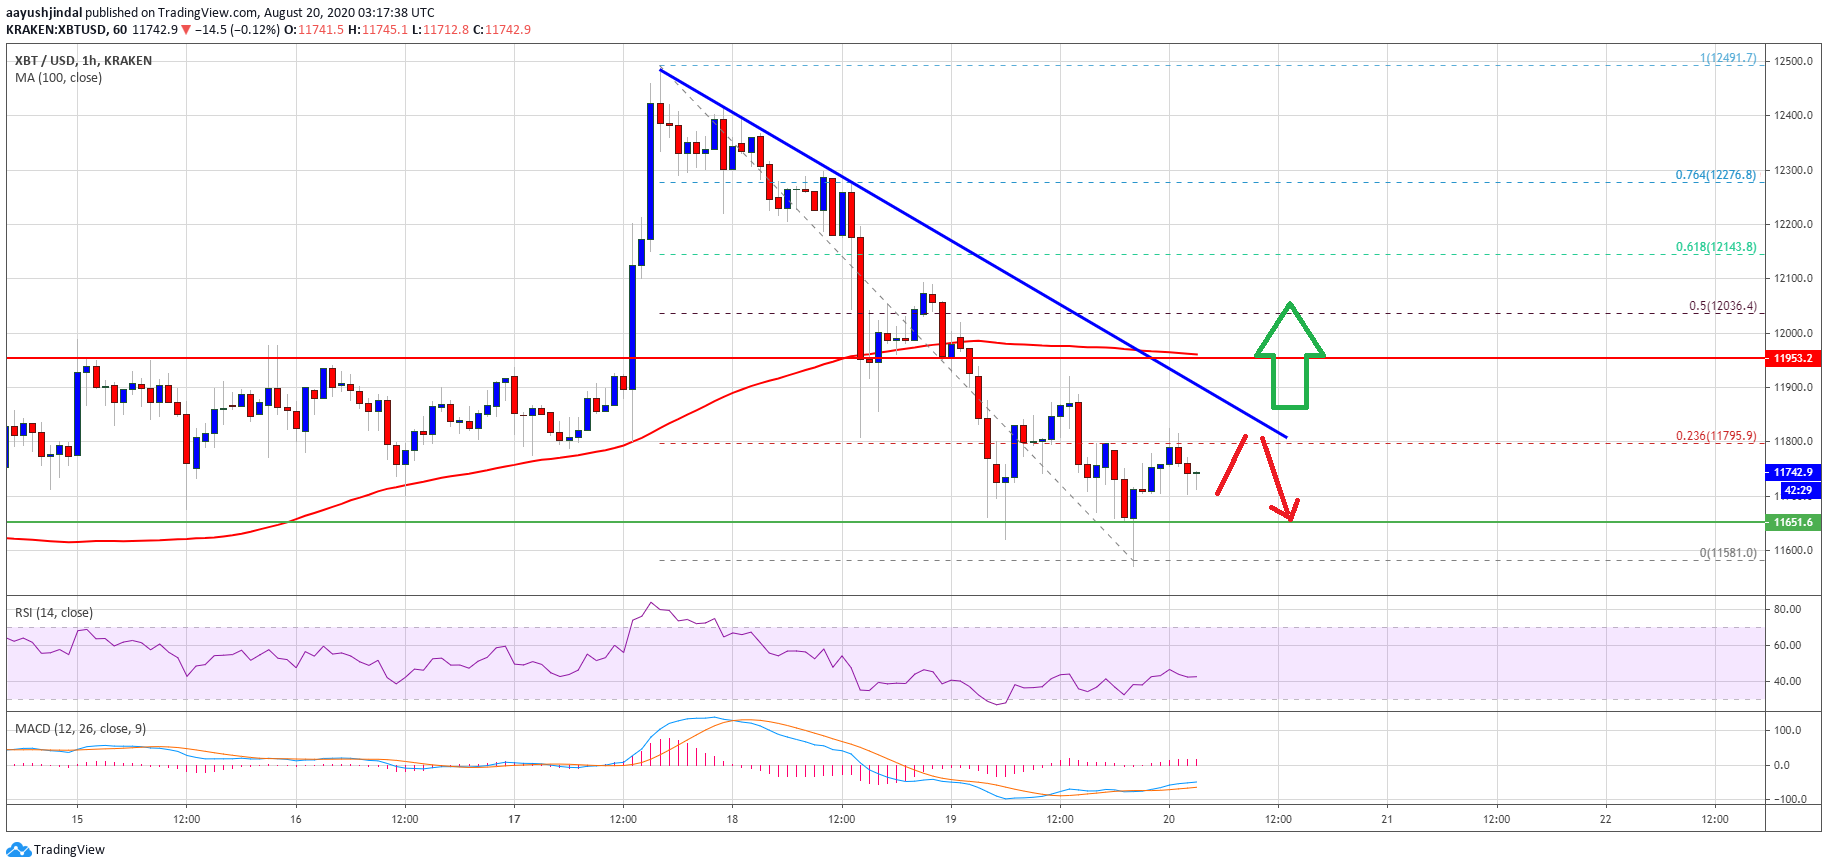
Bitcoin price trades below $12,000. Source: TradingView.com
More importantly, there is a key bearish trend line forming with resistance near $11,880 on the hourly chart of the BTC/USD pair. If there is an upside break above the trend line resistance, the price could continue to recover towards the $11,950 level or the 100 hourly SMA.
The next key resistance is near the $12,000 and $12,050 levels. The 50% Fib retracement level of the recent drop from the $12,490 high to $11,581 low is also near the $12,035 level.
On the downside, the $11,650 and $11,550 support levels are important. If there is a clear downside break and close below $11,500, the price might slide sharply towards the $11,200 and $11,000 levels in the near term.
Fresh Upward Move in BTC?
If bitcoin breaks the trend line resistance, it might retest $12,000. To move into a positive zone and start a fresh increase, the price must settle above the $12,000 and $12,050 levels.
The next major resistance is near the $12,150 level, above which the price could easily rise towards the main $12,500 resistance.
Technical indicators:
Hourly MACD – The MACD is slowly moving into the bullish zone.
Hourly RSI (Relative Strength Index) – The RSI for BTC/USD is now well below the 50 level.
Major Support Levels – $11,650, followed by $11,500.
Major Resistance Levels – $11,880, $12,000 and $12,050.