

The most recent push in Bitcoin price by bulls has resulted in the Relative Strength Index, or RSI, reaching full power.
The commonly used trend-strength measuring tool hasn’t hit such overbought conditions since the June 2019 top. Does this mean that the first-ever cryptocurrency is topping out again, or is this just the start of a more powerful rally?
Daily Bitcoin RSI Stays Overbought For Longest Stretch Since June 2019 Top
Bitcoin price has exploded from lows set on Black Thursday last month, to as high as $9,400 at the time of this writing. And with Bitcoin’s halving just one week away, the trend momentum may only increase from here.
The most recent price action and rally across the crypto space, has caused Bitcoin’s Relative Strength Index to read the highest levels since the June 2019 top.
Related Reading | Bitcoin Price Sets Longest Stretch of Positive Weekly Growth Since May 2017
The RSI is used to measure the strength of an asset’s trend. Any exceptionally strong deviations to one extreme on the RSI, typically suggests an asset has reached overbought or oversold conditions.
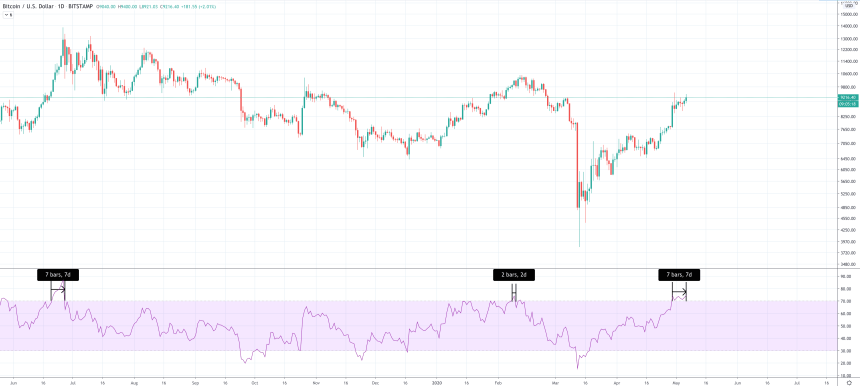

Bitcoin’s RSI is now signaling the longest stretch of overbought conditions since June 2019, even beating out the recent February 2020 top.
That top sent Bitcoin plummeting to under $4,000.
Does the RSI reaching “full power” according to one crypto analyst suggest that the rally is coming to an end, or could it also mean that it is just getting started?
Relative Strength Index May Be Indicating A New Crypto Bull Market Is Here
The RSI reaching such levels on daily timeframes also can act as a trigger for sustained bullish price action.
Zooming out a bit further beyond the June 2019 top, the RSI shows three distinct peaks that held above overbought conditions for extended periods.
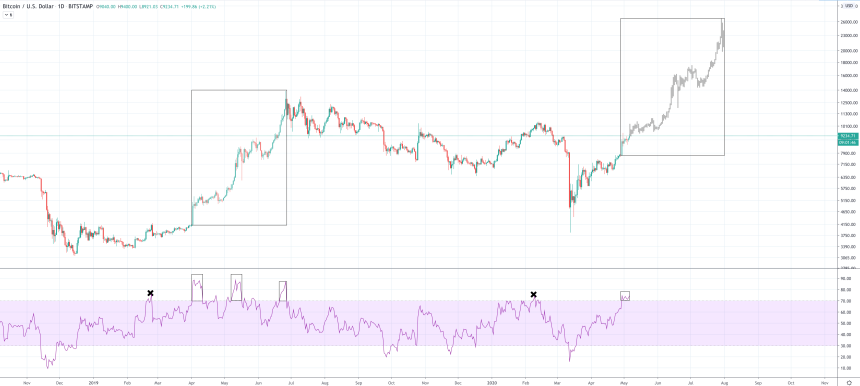
Each one of these peaks didn’t result in a reversal. In this case, the RSI is showing that the trend is so strong, the upside is likely to continue.
The daily RSI can stay overextended for sustained periods during bull markets. The indicator also provides unique reading across different timeframes.
Related Reading | All Bitcoin Fundamentals Scream “Buy” Says Prominent Market Researcher
For example, when switching to weekly timeframes, the RSI is nowhere near overbought conditions, signaling that the current rally has plenty of room on the weekly to grow.
Furthermore, zooming out even further, shows that the RSI is more commonly overbought during bull markets in Bitcoin. Even more interesting, each bullish phase appears to be triggered by the each Bitcoin halving.
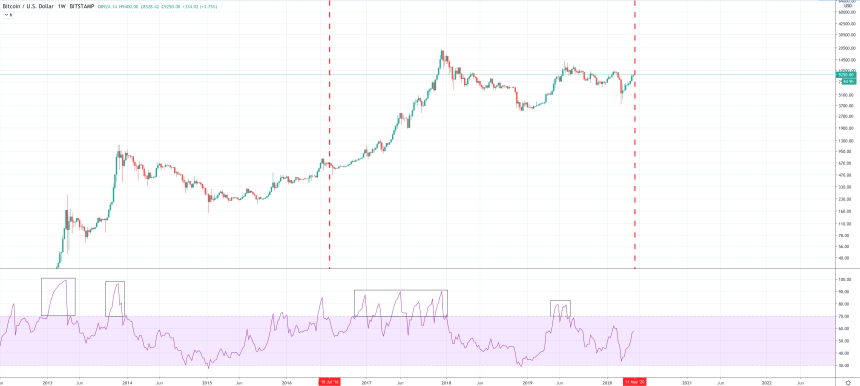
With Bitcoin’s next halving just one week away, and the RSI reaching full power, it could be full steam ahead for Bitcoin’s next bull market.
Featured image from Pixabay, Charts from TradingView