
Reason to trust
How Our News is Made
Strict editorial policy that focuses on accuracy, relevance, and impartiality
Ad discliamer
Morbi pretium leo et nisl aliquam mollis. Quisque arcu lorem, ultricies quis pellentesque nec, ullamcorper eu odio.
Bitcoin price started a downside correction from the $61,700 high against the US Dollar. BTC is holding gains above the $58,500 and $58,000 support levels.
- Bitcoin gained bullish momentum above $60,000 and it even traded above $61,500.
- The price corrected lower below $60,000, but it is still well above the 100 hourly simple moving average.
- There is a key bullish trend line forming with support near $58,200 on the hourly chart of the BTC/USD pair (data feed from Kraken).
- The pair is climbing again and it seems like the bulls are likely to aim a test of $62,000.
Bitcoin Price Remains in a Strong Uptrend
There was a strong increase in bitcoin above the $55,000 and $58,000 resistance levels. BTC even cleared the $60,000 resistance and settled well above the 100 hourly simple moving average.
It traded to a new all-time high near $61,700 before starting a downside correction. There was a break below the $61,000 support level. The price even traded below the 23.6% Fib retracement level of the upward move from the $56,124 swing low to $61,700 high.
However, the bulls were active above the $58,500 and $58,800 levels. There is also a key bullish trend line forming with support near $58,200 on the hourly chart of the BTC/USD pair.
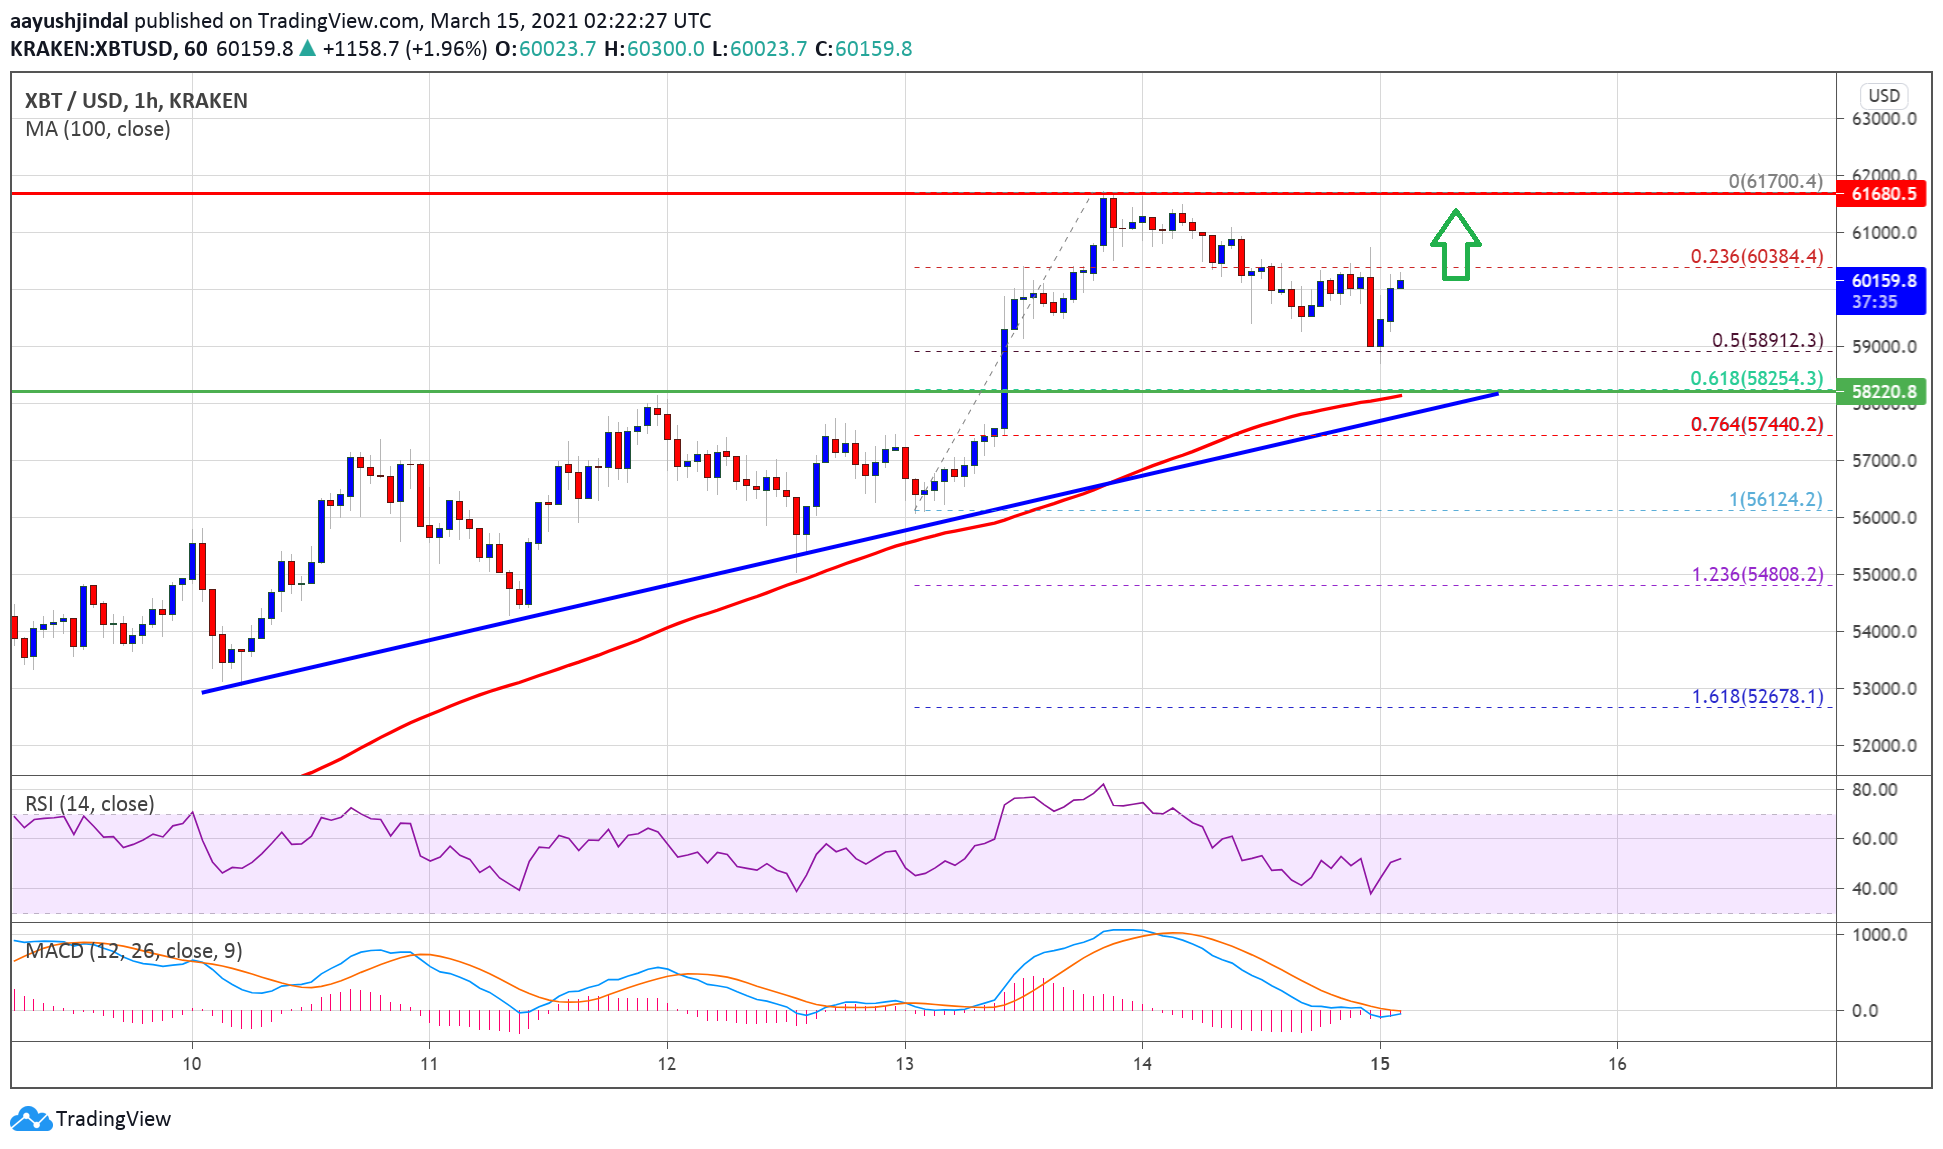
Source: BTCUSD on TradingView.com
Bitcoin also remained stable above the 50% Fib retracement level of the upward move from the $56,124 swing low to $61,700 high. It is now rising and trading nicely above $59,500. An immediate resistance is near the $61,000 level.
The next major resistance is near the $61,700 high. It seems like the price might continue to rise and it could even clear the $62,000 level in the near term.
Dips Supported in BTC?
If bitcoin fails to clear the $61,000 resistance, it could correct lower. The first key support on the downside is near the $59,000 level.
The main support is near the trend line and $58,500. Any more losses might call for a test of the $58,000 support level. If there is a downside break below $58,000, the price could slide towards the $56,200 level in the coming sessions.
Technical indicators:
Hourly MACD – The MACD is now gaining momentum in the bullish zone.
Hourly RSI (Relative Strength Index) – The RSI for BTC/USD is back above the 50 level.
Major Support Levels – $59,000, followed by $58,200.
Major Resistance Levels – $61,000, $61,700 and $62,000.


