The price of BTC/USD opened at 293$ yesterday and declined down to around 277$ earlier today. The price drop can be attributed to Bitstamp’s massive security breach, which cost the company more than 5 million dollars.
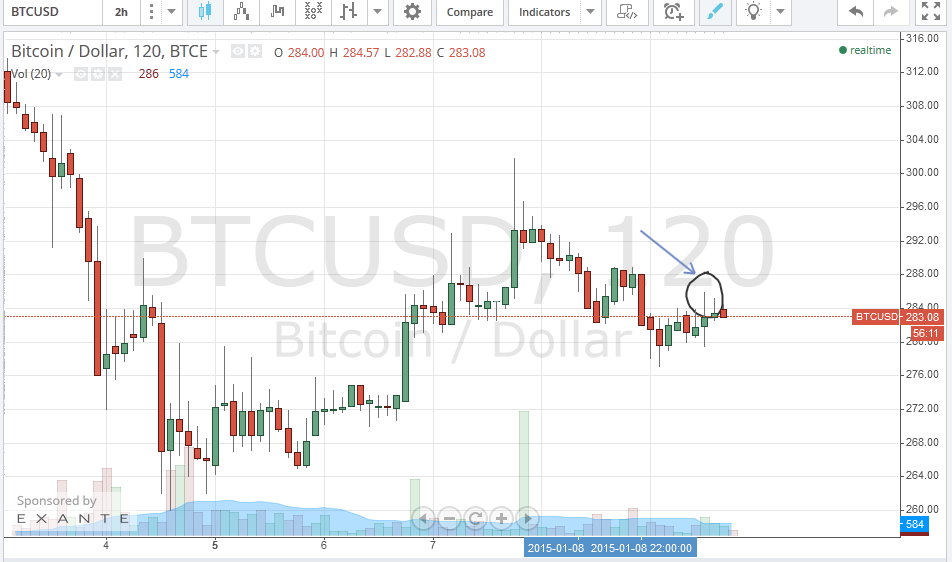
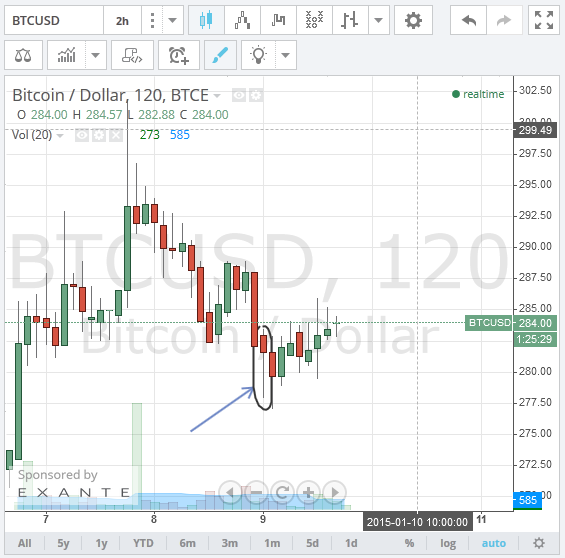
We anticipated yesterday this fall in the price of BTC, which was based on technical analysis of the BTC/USD 4 hourly charts from tradingview.com. The price opened today at around 284$ and continued to fall until the trend reversed at 279$ to begin rising again until it reached 284$. A “hammer” can be noted on the 2 hourly charts, which signaled an end to yesterday’s bearish market (the circle and arrow on the following chart). As the price began to rise long shadows could be noted on the 2 hourly charts which mean that the current buying power isn’t strong enough to support a continued price increase.
Reuters reported earlier today that Bitstamp is likely to resume business later today, which can ignite a short term rally in the price of BTC/USD, but whether or not this can have long term impact is yet to be determined. We cannot see an end to the current downtrend, except if the price stabilizes above 301$ which is a resistance point.
At the time of writing of this article, the price of BTC traded at around 283$ and it is expected to drop down again to test the 279$ support point. The market is unlikely to go above 285$ today as noted by the long shadows on the 2 hourly chart (the circle and arrow on the following chart).