
In this month’s The Bitcoin Monthly, ARK Invest focused on Ethereum and the Merge. As a side dish, they did publish some premium and review-worthy stats that we’re about to cover. Never mind the market, the Bitcoin network keeps producing block after block regardless. The stats that this whole activity produces can be critical in understanding the market, though.
That’s where ARK Invest’s The Bitcoin Monthly comes in. The publication defines itself as “an “earnings report” that details on-chain activity and showcases the openness, transparency, and accessibility of blockchain data.” So, the data we’re about to cover is The Bitcoin Monthly’s reason to be.
The Bitcoin Monthly: 200-Week Moving Average And Investor Cost Basis
- “After closing above its 200-week moving average in July,1 bitcoin’s price reversed and slipped below it in August. Currently at $22,680, the 200-week moving average now seems to be resistance.”
The center couldn’t hold. The price’s recovery was short-lived. Markets are red across the board and bitcoin is no exception. At the time of writing, bitcoin trades at $19,874. For those keeping score, that’s just below last cycle’s all-time high of $20K. Something that shouldn’t happen, but a few degrees of error are always understandable.
- “Bitcoin currently trades above investor cost basis at $19,360, its strongest on-chain support level (…) Importantly, throughout bitcoin’s history, trading at investor price usually marks a bottoming process.”
Times are tough, but bitcoin still trades above investor cost basis. The Bitcoin Monthly clarifies, “Investor price is calculated by subtracting the cost basis of miners from the general cost basis of the market.” As we see it, The Bitcoin Monthly is calling the bottom. They didn’t say it in those exact words, but they certainly insinuated it.
Is the bottom really in, though?
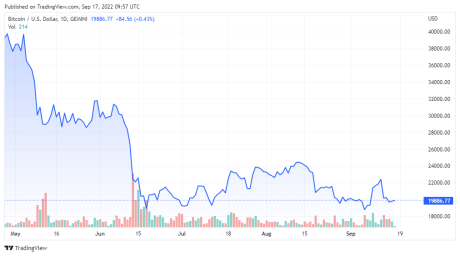

BTC price chart for 09/17/2022 on Gemini | Source: BTC/USD on TradingView.com
The Bitcoin Monthly: Short-Term Holder Vs. Long-Term Holder
- “The short-term-holder (STH) cost basis is approaching its longterm-holder (LTH) cost basis ––an event that has marked cyclical bottoms in the past. (…) Since the end of July, the difference between short- and long-term holders’ cost basis has shrunk from $5,840 to $2,500”
The Bitcoin Monthly sees it as a sign that “the market typically is capitulating and shifting back to long-term participation.” Bitcoin’s consolidation process might be ending soon. We could stay for a while in the bottom area, though. That has happened before. The point is, all of the indicators The Bitcoin Monthly highlighted this month point in the same direction. To the bottom.
- “The supply held by long-term bitcoin holders is 34,500 coins away from reaching 13.55 million– its all-time high. Long-term-holder supply constitutes 70.6% of total outstanding supply.
This one is the most bullish of all the featured stats. To clarify, coins that haven’t moved in 155 days or more qualify as “long-term holder supply.” The tourists and the people with high hopes left a long time ago. And the lion’s share of the bitcoin supply is now in the true believers’ possession. A remarkable situation that doesn’t get mentioned enough.
About The Ethereum Merge
- “In August, ether outperformed bitcoin by 7.6% (…) Historically, ether has outperformed bitcoin during “riskon” bull markets and underperformed during “risk-off” bear markets.”
The merge’s effects affected the market throughout the whole narrative. Even though we’re in a “risk-off bear market,” ETH took over and lead the market for a while there. They accomplished the mythical feat and… the market turned on them. After what seemed like mission accomplished, ETH’s price started to bleed.
Hidden behind a secret door, that’s what The Bitcoin Monthly contained.
Featured Image by Maxim Hopman on Unsplash | Charts by TradingView