

Bitcoin has seen some notable upwards momentum today that has allowed the benchmark cryptocurrency to surmount the heavy resistance that it was previously facing at $9,200.
Today’s upwards breakout marks a bullish resolution to the extended bout of sideways trading that the crypto was previously facing while it hovered around $8,800 for the past several days.
It now appears that its next upswing could just be getting started, as BTC has now broken above a previously formed descending trendline that had been guiding it lower.
A popular technical indicator that has flashed before previous parabolic uptrends also just emerged for the first time in over 300 days.
This could be a sign that a big upside movement is imminent.
Bitcoin Flips Key Trendline as Bulls Shatter Previous Resistance at $9,200
At the time of writing, Bitcoin is trading up just under 4% at its current price of $9,240, marking a massive climb from daily lows of $8,700 that were set yesterday.
In the time following the benchmark cryptocurrency’s firm rejection at $9,500 last week, BTC had been stuck below $9,000, with each visit up to the lower-$9,000 region being met with significant selling pressure.
The firm break above this level, however, has opened the gates for further upside.
One analyst explained in a recent tweet that this overnight movement allowed Bitcoin to shatter a descending trendline that had been formed throughout the past week.
He further noted that this recent strength has come about as a result of the crypto’s firm defense of its point-of-control level at $8,800.
“BTC update: This trendline flip is part of what made me close my short yesterday; that and we formed support back above the range POC and CVD stopped bleeding when we flipped it,” he explained.

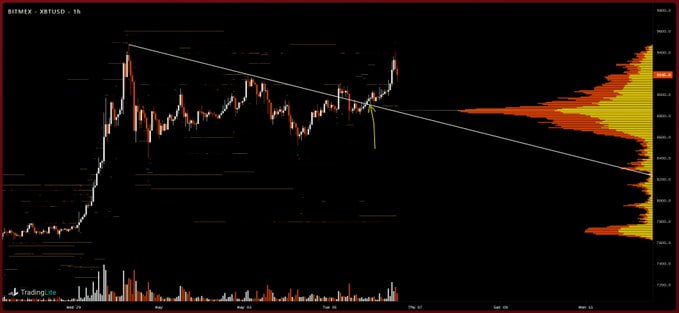
While looking at the bids marked on the above chart, it does appear that the strong support established just below Bitcoin’s current price could bolster how it trends in the day ahead.
Elusive Technical Indicator Flashes for First Time in Over 300 Days
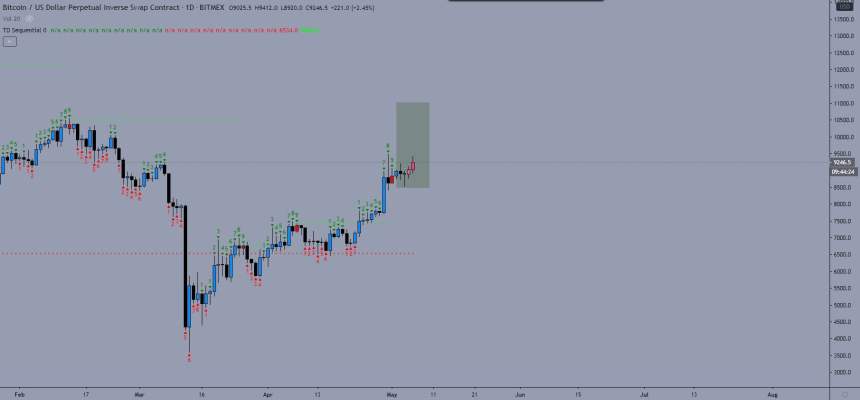
Bitcoin’s TD Sequential indicator has growing in popularity throughout the past several months, as it has accurately predicted multiple cycle bottoms and tops.
This indicator is now flashing a long signal for the first time in 313 days.
The last time that this indicator emerged with a long signal was just before Bitcoin’s rally to highs of $13,800 last Summer.
One popular options trader spoke about this in a recent tweet, saying:
“BTC: TD starting to print pink on the daily. Last time it did this was 313 days ago.”

The culmination of this extremely bullish technical indicator and Bitcoin’s growing technical strength seems to suggest that the crypto is bound to see some upside in the near-term.
Featured image from Unplash.