
Reason to trust
How Our News is Made
Strict editorial policy that focuses on accuracy, relevance, and impartiality
Ad discliamer
Morbi pretium leo et nisl aliquam mollis. Quisque arcu lorem, ultricies quis pellentesque nec, ullamcorper eu odio.
Bitcoin price remained well bid above $11,400 and it broke the key $11,600 barrier against the US Dollar. BTC is now trading above the 100 hourly SMA and it could continue to grind higher.
- Bitcoin is back in a positive zone above the $11,500 and $11,600 resistance levels.
- The price settled nicely above the 100 hourly SMA, opening the doors for a push to $12,000.
- There was a break above a key bearish trend line with resistance near $11,560 on the hourly chart of the BTC/USD pair (data feed from Kraken).
- The pair could gain 5%-10% as long as it is above the 100 hourly simple moving average.
Bitcoin Price is Gaining Momentum
Yesterday, we discussed the importance of the 100 hourly simple moving average and $11,600 for the next bitcoin rally against the US Dollar. BTC remained well bid above the $11,400 level and it managed to settle above $11,500.
As a result, there was a crucial upside break above the $11,600 resistance and the 100 hourly simple moving average. There was also a break above a key bearish trend line with resistance near $11,560 on the hourly chart of the BTC/USD pair.
The pair even climbed above the $11,800 level and traded as high as $11,852. It is currently correcting gains and trading below $11,800. Bitcoin tested the 23.6% Fib retracement level of the recent upward move from the $11,272 low to $11,852 high.
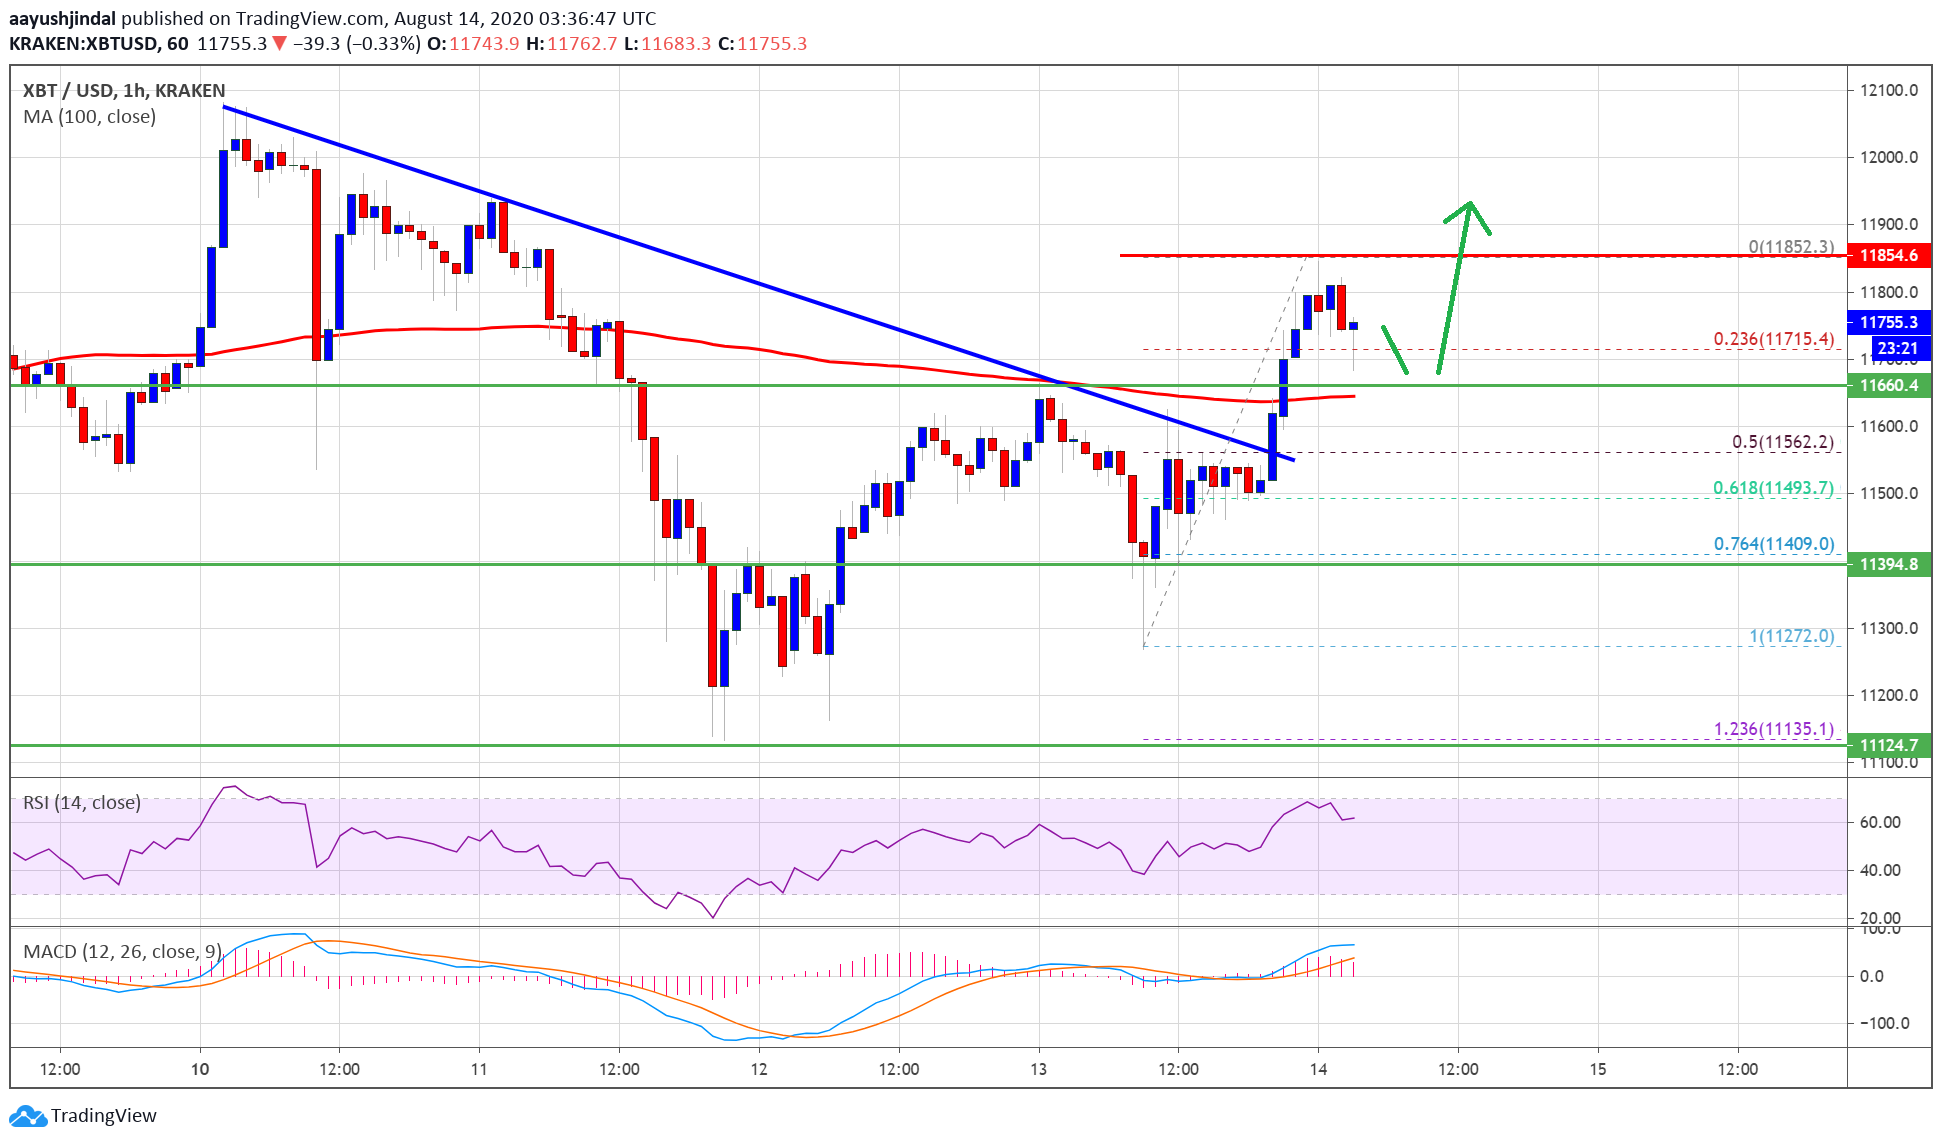
Bitcoin price trades above $11,650. Source: TradingView.com
On the downside, there is a strong support forming near the $11,650 level and the 100 hourly SMA. The next major support is near the $11,550 level or the 50% Fib retracement level of the recent upward move from the $11,272 low to $11,852 high.
On the upside, there is a short-term resistance near the $11,850 level. A successful close above the $11,850 level might open the doors for a push towards $12,000 or even $12,200 in the near term.
Another Failure in BTC?
If bitcoin fails to clear the $11,850 resistance or the $12,000 barrier, there could be a downside correction. The main support is now forming near the $11,550 level.
If there is a downside break below the $11,550 support, the price could extend its decline towards the $11,200 support zone.
Technical indicators:
Hourly MACD – The MACD is slowly gaining pace in the bullish zone.
Hourly RSI (Relative Strength Index) – The RSI for BTC/USD is now back above the 50 level.
Major Support Levels – $11,650, followed by $11,550.
Major Resistance Levels – $11,850, $12,000 and $12,200.


