Bitcoin Price Key Highlights
- Bitcoin price went for a test of the channel support as predicted in an earlier article and a bounce took place.
- This signals that price could be headed back to the channel resistance to carry on with its uptrend.
- A fresh round of risk aversion could keep bitcoin in demand but technical indicators are giving mixed signals.
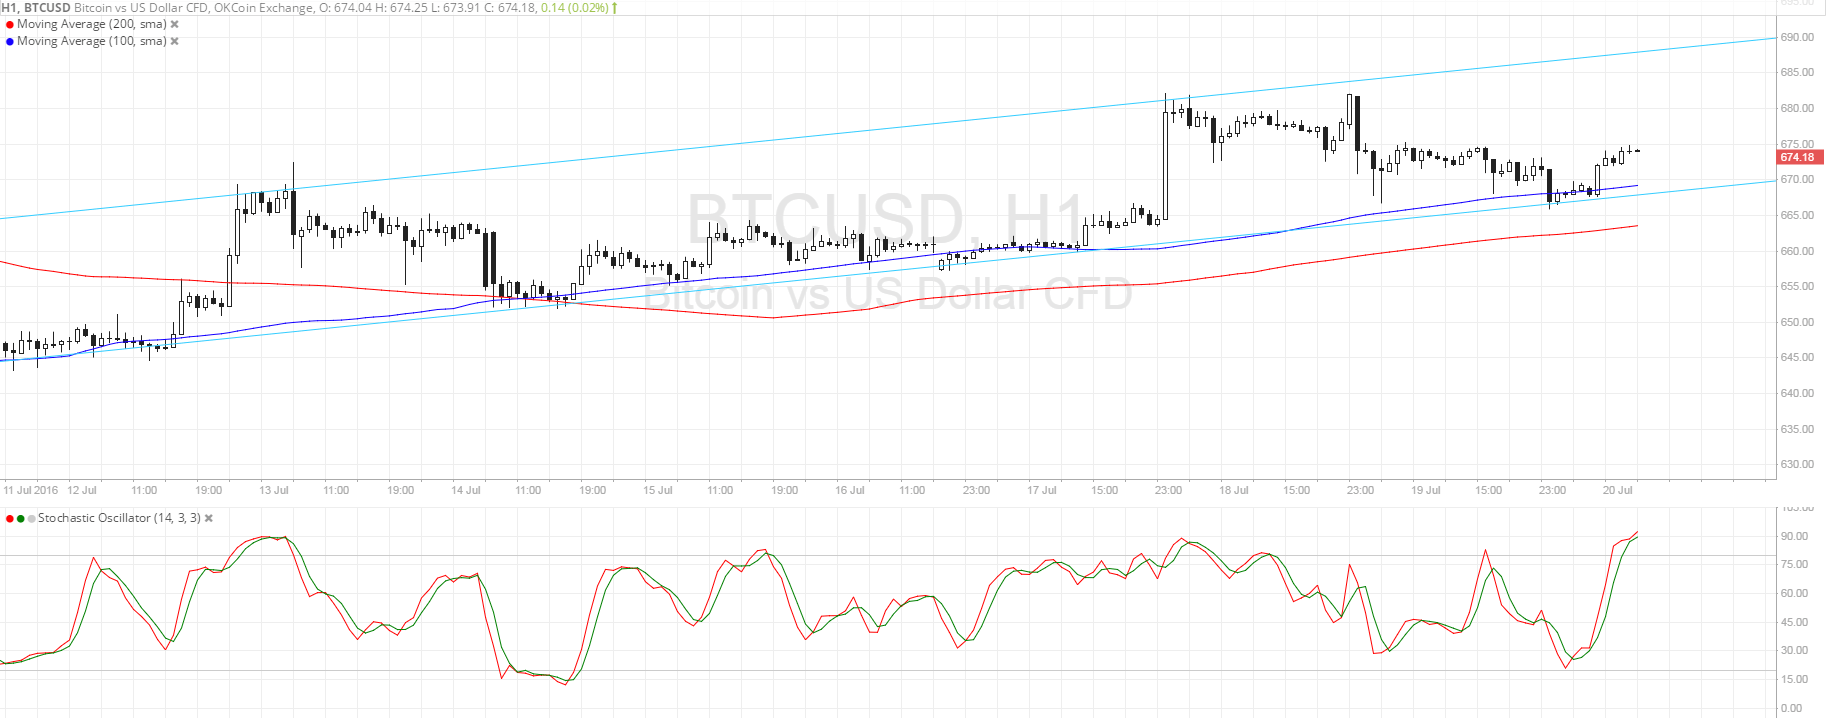
Bitcoin price found support at the bottom of its ascending channel and looks prime for another test of resistance.
Technical Indicators Signals
The 100 SMA is above the 200 SMA so the path of least resistance is to the upside. This suggests that bitcoin price might climb to the top of the channel at $690-700 or at least until the previous highs closer to $680. In addition, the 100 SMA coincides with the bottom of the channel, adding to its strength as a floor.
However, stochastic is already in the overbought area, which means that buyers could run out of steam soon. The oscillator hasn’t crossed down to indicate a return in selling pressure yet so a few more gains could be possible.
If a break below the channel support at $670 is seen, bitcoin price could still bounce off the 200 SMA dynamic inflection point at $665. A candle closing below this level could lead to a drop to the next area of interest at $650.

Market Events
The IMF downgraded global growth forecasts in yesterday’s update, bringing fresh risk-off vibes in the financial markets. The institution highlighted the potential risks that the Brexit could bring on the UK and the rest of the developed nations.
Event risks for the rest of the week include the unscheduled announcement of the Reserve Bank of New Zealand and the European Central Bank’s monetary policy decision on Thursday. Dovish remarks could keep risk aversion in play, reviving demand for alternative assets like bitcoin.
For now, there seems to be no signs of unease among Chinese investors as data from the world’s second largest economy beat expectations last week and the IMF even upgraded GDP estimates for China yesterday. Still, any kind of easing or intervention from their government could spur another boost in bitcoin price again.
Charts from SimpleFX