The European session is drawing to a close and, for our efforts this evening, we are going to tighten things up and try and do a little bit of scalp trading in the bitcoin price markets. Anybody who caught our analysis this morning will know that we went into the morning session with a relatively wide range. We did get some volatility and – in line with the action – we managed to jump in and out of the markets for a couple of quick profits throughout the day.
Heading into this evening we would like to do the same but, as mentioned, we are going to be targeting much tighter take profit levels and using similarly tight risk management principles on execution.
So, with this noted, and as we move into the session this evening, here is a look at what we are focusing on in the bitcoin price market and where we intend to get in and out of the markets according to the rules of our intraday strategy.
As ever, take a quick look at the chart below before we get started. It is a one-minute candlestick chart and it has our key range overlaid in green. It also illustrates how price got to its current point throughout the session today.
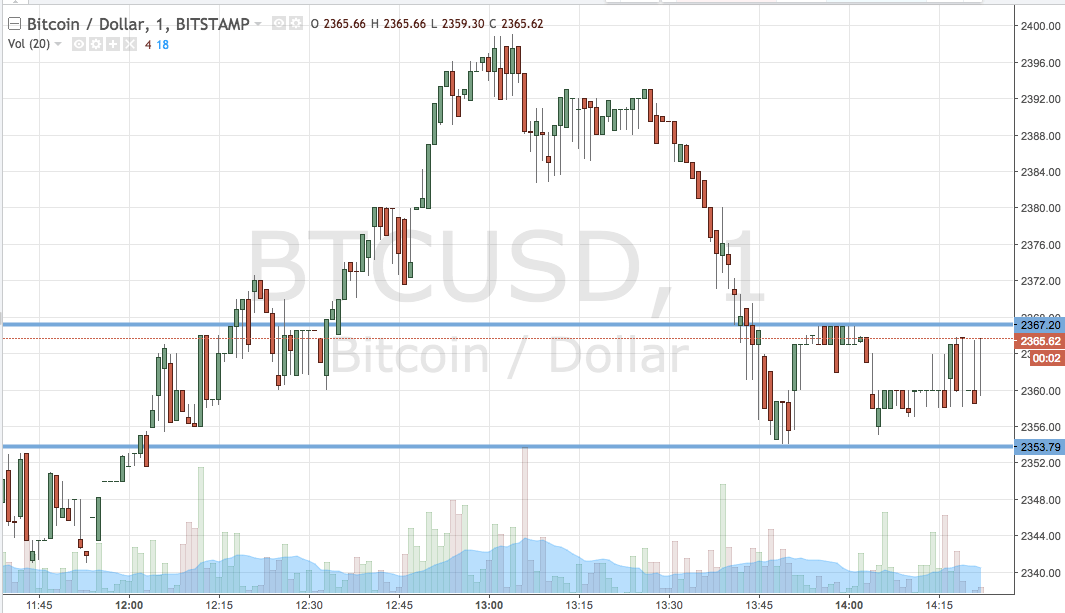

As the chart shows, the range we are looking at this evening is defined by support to the downside at 2353 and resistance to the upside at 2368. Standard breakout rules apply (although modified a little bit to incorporate a scalp strategy), with a close above resistance validating an immediate upside target of 2390 and a close below support getting us in short towards a target of 2340. A stop loss on the first trade somewhere in the region of 2362 works to define risk nicely, while a similar stop on the second trade at 2360 looks good.
Charts courtesy of Trading View