Here we are at the end of another week of trading in the bitcoin price and what an interesting one it’s been. We’ve seen action in all directions and we’ve been able to get in and out of trades of all shapes and sizes. It looks like we’re going to be closing out the week net up on the markets (which as we’ve said a couple of times this week isn’t too difficult when things are moving as they are) but we can’t really take this for granted.
We’ve got to ensure that – whatever happens today – we stay on top of our risk management.
So, without any further ado, let’s get things moving for the session.
As ever, take a quick look at the chart below before we get started. It’s a one-minute candlestick chart and our key range is overlaid in blue.
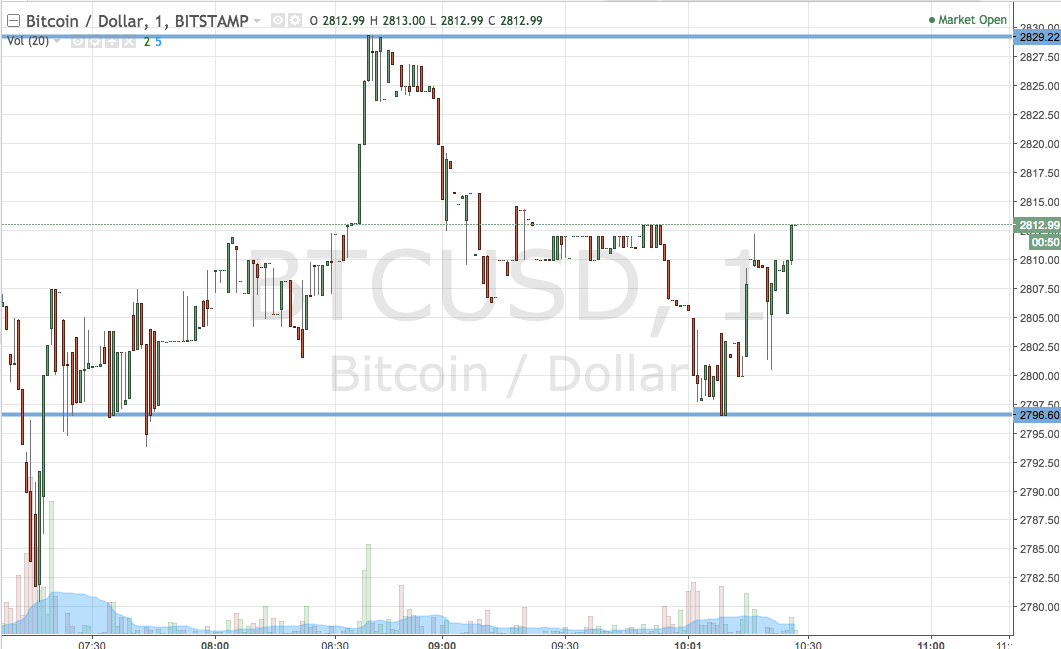

As the chart shows, then, the range we’re looking at right now is defined by support to the downside at 2796 and resistance to the upside at 2829. That’s a pretty wide range and it’s straddling the 2800 key psychological level, so we’re going to bring intrarange to the session today. Long at support (on a bounce) and short from resistance (on a correction) towards a target of the opposing levels. A stop loss on the positions just the other side of the entry will ensure we are taken out of the positions in the event of a breakout.
Looking at our breakout strategy, if we see price close above resistance, we’ll be in long towards an immediate upside target of 2850. A stop at 2820 works well for the trade.
From a short perspective, a close below support will have us in towards a downside target of 2770. A stop at 2805 looks good.
Let’s see what happens.
Charts courtesy of Trading View