The action we saw in the bitcoin price overnight was in contrast to that which we expected based on yesterday’s intraday action. We thought we might see some degree of medium-term value add, or in other words an increase in value, as volume picked up, and volatility followed. As it turned out, price traded relatively flat throughout the early period, but then declined pretty sharply late night and into early morning Europe. Right now, price is currently trading somewhere around the base of this decline, and very close to long-term psychological support around the 900 level.
The question now, is, what is next? Can price stabilize, and avoid breaking into the 800s longer-term, or are we going to see a return to the downside momentum as we head into the European afternoon? Let’s try and figure it out. As ever, take a quick look at the chart below to get an idea of what is on, and where we’re looking to trade during today’s session. It is a five-minute candlestick chart, and it has our range overlaid in green.
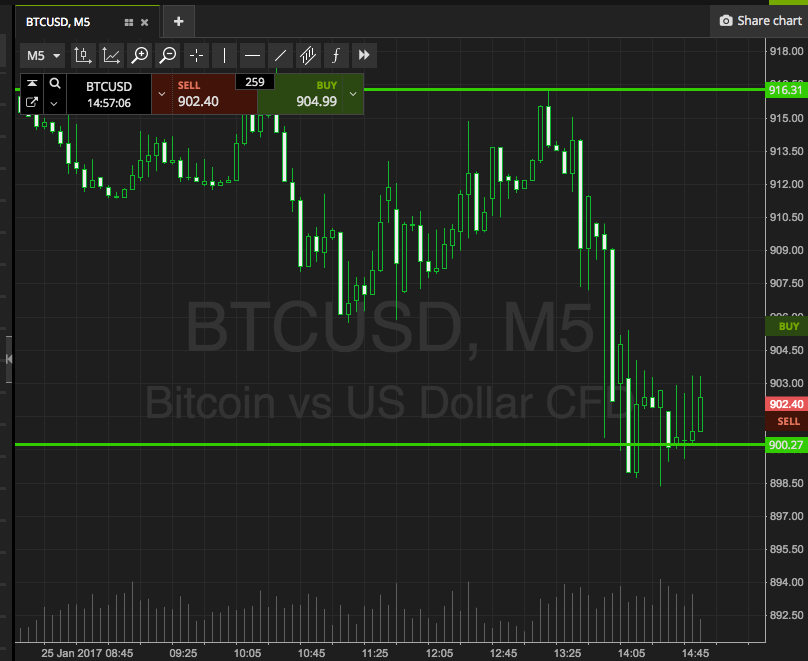

As the chart shows, the range in focus for today is defined to the downside by the above-mentioned 900 level as support, and to the upside at 916 for resistance. This is just about wide enough for us to go at price intrarange, so long at support and short at resistance, with a stop loss is just the other side of the entry to define risk.
If we see price break above resistance, we will enter long towards an immediate upside target of 930. A stop loss on the trade at 912 defines risk nicely. Conversely, a close below support will put us short towards 890. Again we need a stop us on this one, and somewhere in the region of 906 is pretty aggressive, but works well.
Let’s see how things play out. With any luck, we won’t have to enter short, and 900 will hold longer-term.
Charts courtesy of SimpleFX