

Its been a few days since we reported on our bitcoin price intraday technical analysis strategy, and while the holiday season (plus new year) has disrupted our trading a little bit, things are now back on track for a profitable 2016. Additionally, the pause in our strategy implementation has given us a chance to step back and take stock of the markets, meaning hopefully we can enter the year with a little additional clarity. So, with this said, and as we head into the mid afternoon session in Europe, what are the levels we are looking at in today’s markets, and where are we looking at getting in and out of the markets on today’s action. Let’s get back in to the swing of things, and take a look. As ever, get a quick look at the chart to get an idea of today’s range in the bitcoin price.
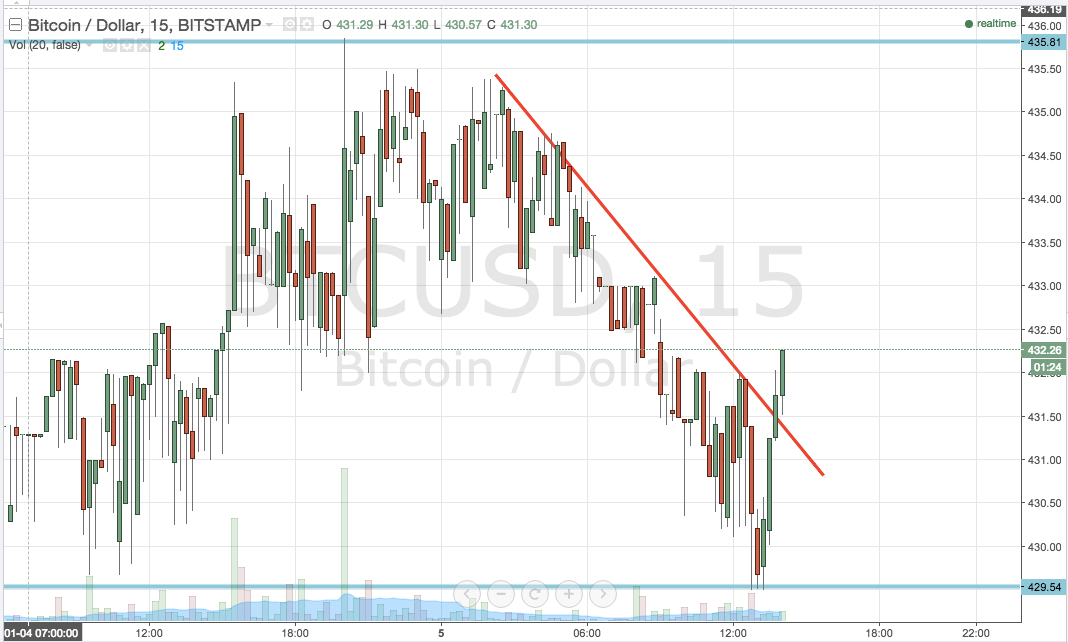

As the chart shows, we are running a pretty tight ship today. Our intraday range is defined as in term resistance at 435.81 and in term support at 429.54. This gives us about six dollars’ worth of range to play with from an intrarange perspective, and around ten dollars’ worth of reward – assuming predefined risk profiles – associated with our breakout strategy. We’ve also outlined an upper, downward trending resistance channel. We broke out of this to the upside a little earlier, and so it may not be relevant going forward. However, if we get a retest of this channel this afternoon, it could reinforce support (range) and be a great bullish intrarange signal.
So, intrarange first. As mentioned, we bounced from a support and broke through channel resistance, which put us in a long entry towards in term resistance at the aforementioned 453.81. A stop on this one at 427.5 defines our downside risk, and will take us out of the trade in the event that we get a bias reversal and start to trade to the downside.
If we get a correction from resistance, it will put us short towards in term support, with a stop loss somewhere in the region of 438 giving us a nice risk reward profile on the setup. For the more conservative trader, a shorter term, mid-range target on this short trade of 432 flat is is less risky option. Bear in mind, however, that on this entry you will need to tighten up your stop to about a one dollar above resistance range.
Looking at our bitcoin price breakout strategy, if the current upside momentum continues, we will not only hit our target but also look to enter on a break of resistance. If we get a close above 435.81, we will enter long towards a conservative, medium term target of 440 flat. A stop on this one somewhere in the region of 434.5 keeps things attractive from a risk management perspective.
Looking the other way, and if the current momentum reverses, a close below our predefined in term support at 429.54 will initiate a short entry towards an (again conservative) target of 425 flat. Again we need a pretty tight stop, with somewhere in the region of 430.5 looking valid.
Happy trading!
Charts courtesy of Trading View