Little by little, we’re seeing the bitcoin price inch up towards a price at which we can claim that we’re seeing some degree of long term return to the overarching upside momentum. Today’s action, while nothing glamorous, brought with it a steady appreciation towards the upper end of our target range, and we managed to get in long on a break of our predefined resistance level this afternoon. The break preceded a take profit hit, and we drew a quick gain from the market.
And that’s where things stand. We’re not quite at the point yet where we can say that 1200 is in play as an immediate upside target, but we’re getting there, and readers can be assured that when we do, they’ll know.
So what’s the deal this evening?
Let’s take a look. As ever, before we get started, get a look at the chart below to get an idea of where things stand right now, and where we are looking to get in and out of the markets this evening as when things move. The chart is a five-minute candlestick chart (as usual) and it’s got our key range overlaid in green.
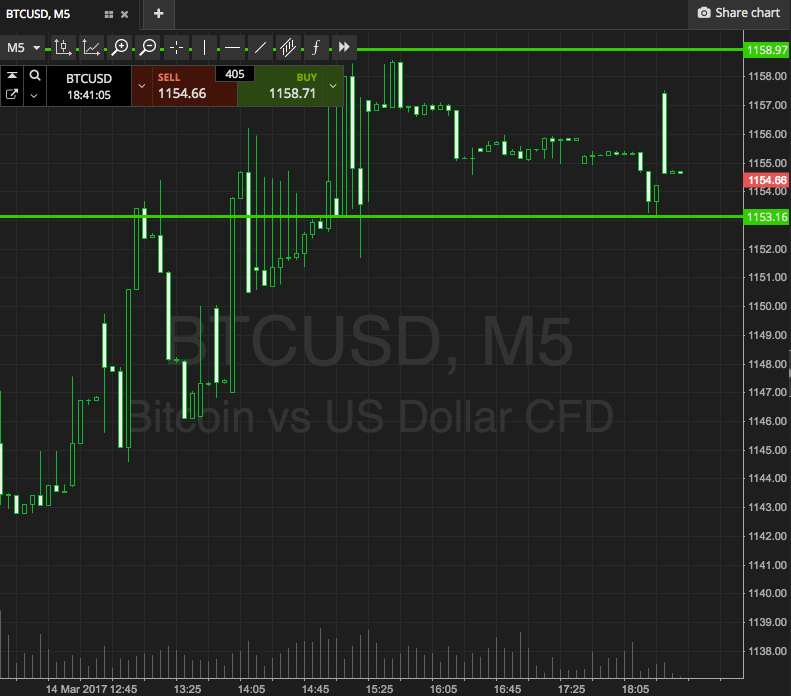

As the chart shows, our range this evening is defined by support to the downside at 1153, and resistance to the upside at 1159. It’s a pretty tight range, so intrarange trading is really out of the question – at least for now. If this changes, we’ll let readers know.
So, if we see price break above resistance, we’ll look to get in to a long position towards an immediate upside target of 1169. A stop on the trade at 1156 defines risk.
Looking the other way, if price breaks below support, we will be in a short entry towards 1143. Our stop on this one is at 1156 again. Mirror image trades. Neat.
Charts courtesy of SimpleFX