So another week is underway in our bitcoin price trading efforts and it looks as though it is going to be another interesting one. When we closed out the week last week, price was experiencing something of a correction on the monstrous run we had seen in the run-up to the Friday European session. Over the weekend, this correction continued a little bit further than we would have preferred, but it eventually bottomed out, and price now looks to be gradually resuming its upside overarching trend.
So, with this in mind, and as we move forward into today’s session out of Europe, here is a look at what we are going for in the bitcoin price with an analysis of where we will look to get in and out of the markets if and when price brings any volatility to the table.
As ever, take a quick look at the chart below before we get started. It is a three-minute candlestick chart (a little bit unusual, but no harm in mixing things up now and again) and it has our key range overlaid in blue.
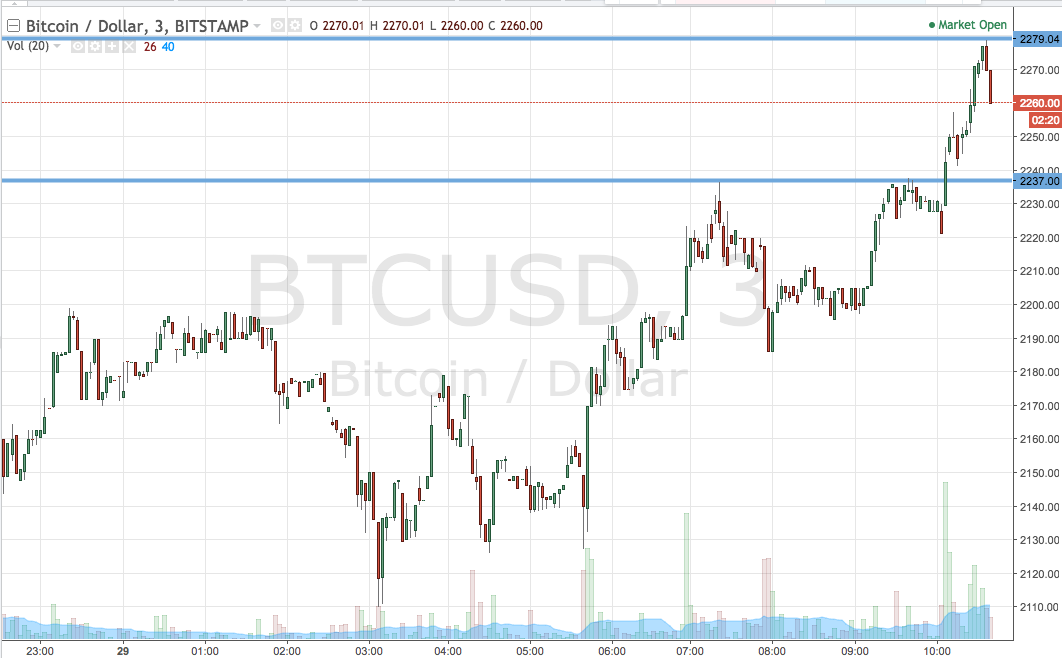

So, as the chart shows, the range we have got in our crosshairs for the session today is defined by support to the downside at 2237 and resistance to the upside at 2279. Plenty of room for intrarange trading here, so long that support and short-term correction from resistance targeting the opposing levels.There’s plenty of room for intrarange trading here, so we’ll be in long at support and short on a correction from resistance targeting the opposing levels.
Looking at our breakout strategy, if we see price close above resistance we will enter long towards an immediate upside target of 2300. A stop loss on the trade at 2270 works well.
Looking south, a close below support at 2237 will have us into a short trade towards 2210. Again a stop loss is necessary on this one, and somewhere in the region of 2245 looks good.
Charts courtesy of Trading View