Okay then, here we go with a new week of trading in the bitcoin price, and we’ve already get plenty to discuss. Readers that were with us at the end of last week will remember that we were watching the 1100 flat level as a key region of longer term support. The idea that this level would hold firm remained a key underpinning of our approach, but with the SEC decision regarding the ETF that’s been holding all of our attention over the last however many weeks pending, no level was completely safe. As things turned out, the decision went against us, and the bitcoin price took a real hit. However, we kept one eye on our support level, and while it broke temporarily, it was a spike break, nothing more.
So this, while not great short term, at least gives us something to look at medium term.
Anyway, we’re focusing on the intraday here, so let’s get down to the smaller timeframe charts and try and get some key levels outlined that we can go at moving forward.
As ever, take a quick look at the chart below to get an idea of what’s on, and where things stand from a price perspective right now. It’s a five-minute candlestick chart and it’s got our key range overlaid in green.
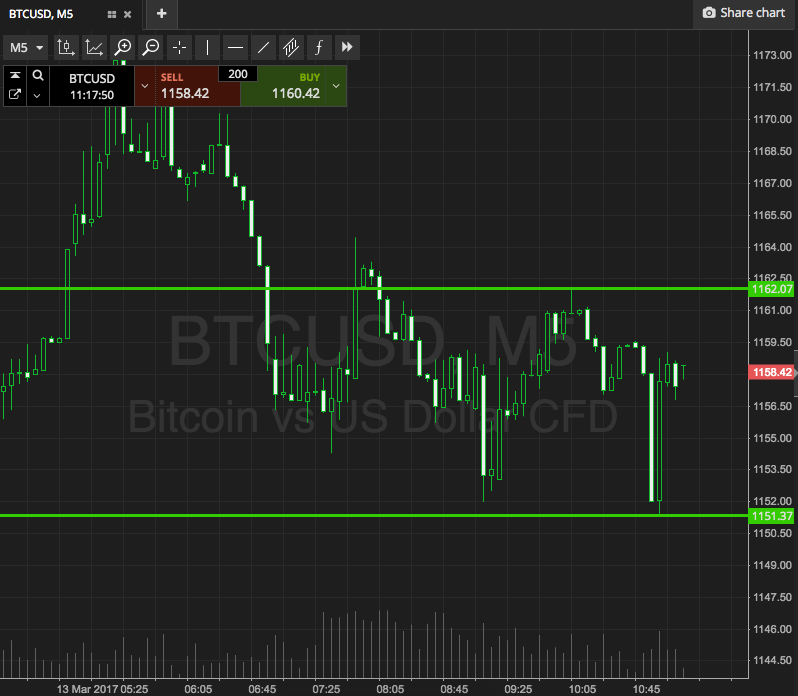

As the chart shows, the range we are focusing on right now is defined by support to the downside at 1151 and resistance to the upside at 1162. We’re looking to go at price with a breakout strategy only today, so no intrarange trades for now.
So if we see a break above resistance, we’ll get in long towards an immediate upside target of 1175. Conversely, a close below support will get us in short towards towards a downside target of 1140.
Let’s see how things play out.
Charts courtesy of SimpleFX