We’ve come to the end of the European session in our bitcoin price trading efforts and it’s time to take a look at how action played out today and – in turn – put together a strategy that adapts to intraday action and should allow us to draw a profit from the market as the US session crosses over and beyond.
Anyone that caught our coverage this morning will know we are looking at $5,000 as the next major threshold. This remains unchanged. That we are looking at that level as a major target, however, doesn’t mean we can’t set up against some slightly nearer term targets and pick up short term profits on intraday volatility. With this in mind, here’s a look at where we are looking to get in and out of the markets this evening according to the rules of our intraday strategy. As ever, take a quick look at the chart below before we get started so as to get an idea where things stand right now. It’s a one-minute candlestick chart and it’s got our key range overlaid in red.
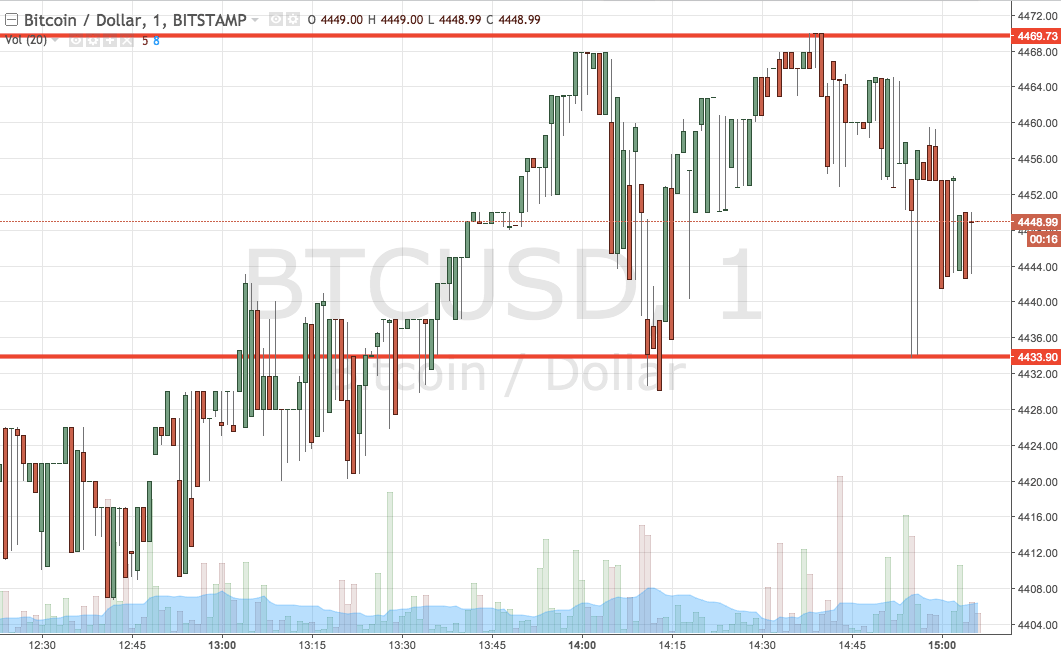

As the chart shows, the range we are going after tonight is defined by support to the downside at 4433 and resistance to the upside at 4469. We are going to go at the market with just our breakout strategy for now; things are a little too tight for us to bring our intrarange approach to the table, but if markets widen out a little we might change that.
So, if we see price close above resistance, we will look at entering long towards an immediate upside target of 4500. A stop on the position somewhere in the region of 4460 will ensure we are taken out of the trade automatically in the event of a bias reversal.
Looking the other way, a close below support will have us in short towards a downside target of 4400. A stop on this one at 4440 looks good for the time being.
Charts courtesy of Trading View