
- Bitcoin briefly closed above $6,400 for the second time in seven days.
- The cryptocurrency later pulled back by circa $400 amid profit-taking.
- It found support near $9,000, raising concerns about an extended move towards $7,500.
Bitcoin’s impressive rebound from its mid-March lows extended its upward move above $6,400 on Wednesday. But the price action left the cryptocurrency alarmingly overbought – even raising the possibility of a $1,500 price correction.
Resistance Fractal
The bitcoin-to-dollar exchange rate failed to hold the $6,400-level and fell by circa $400 into Thursday, showing an extreme amount of selling near the top. The pair eventually plunged to its intraday low near $9,000, a level that held it from extending its downside correction any further.
It is not a standalone incident. Just a week before, bitcoin pierced above $9,400 but declined back to as low as $8,407 on Coinbase crypto exchange. The fractal suggested that there is a great deal of bearish sentiment that resides near $9,400. It also shows that $9,000 is a weak support level.
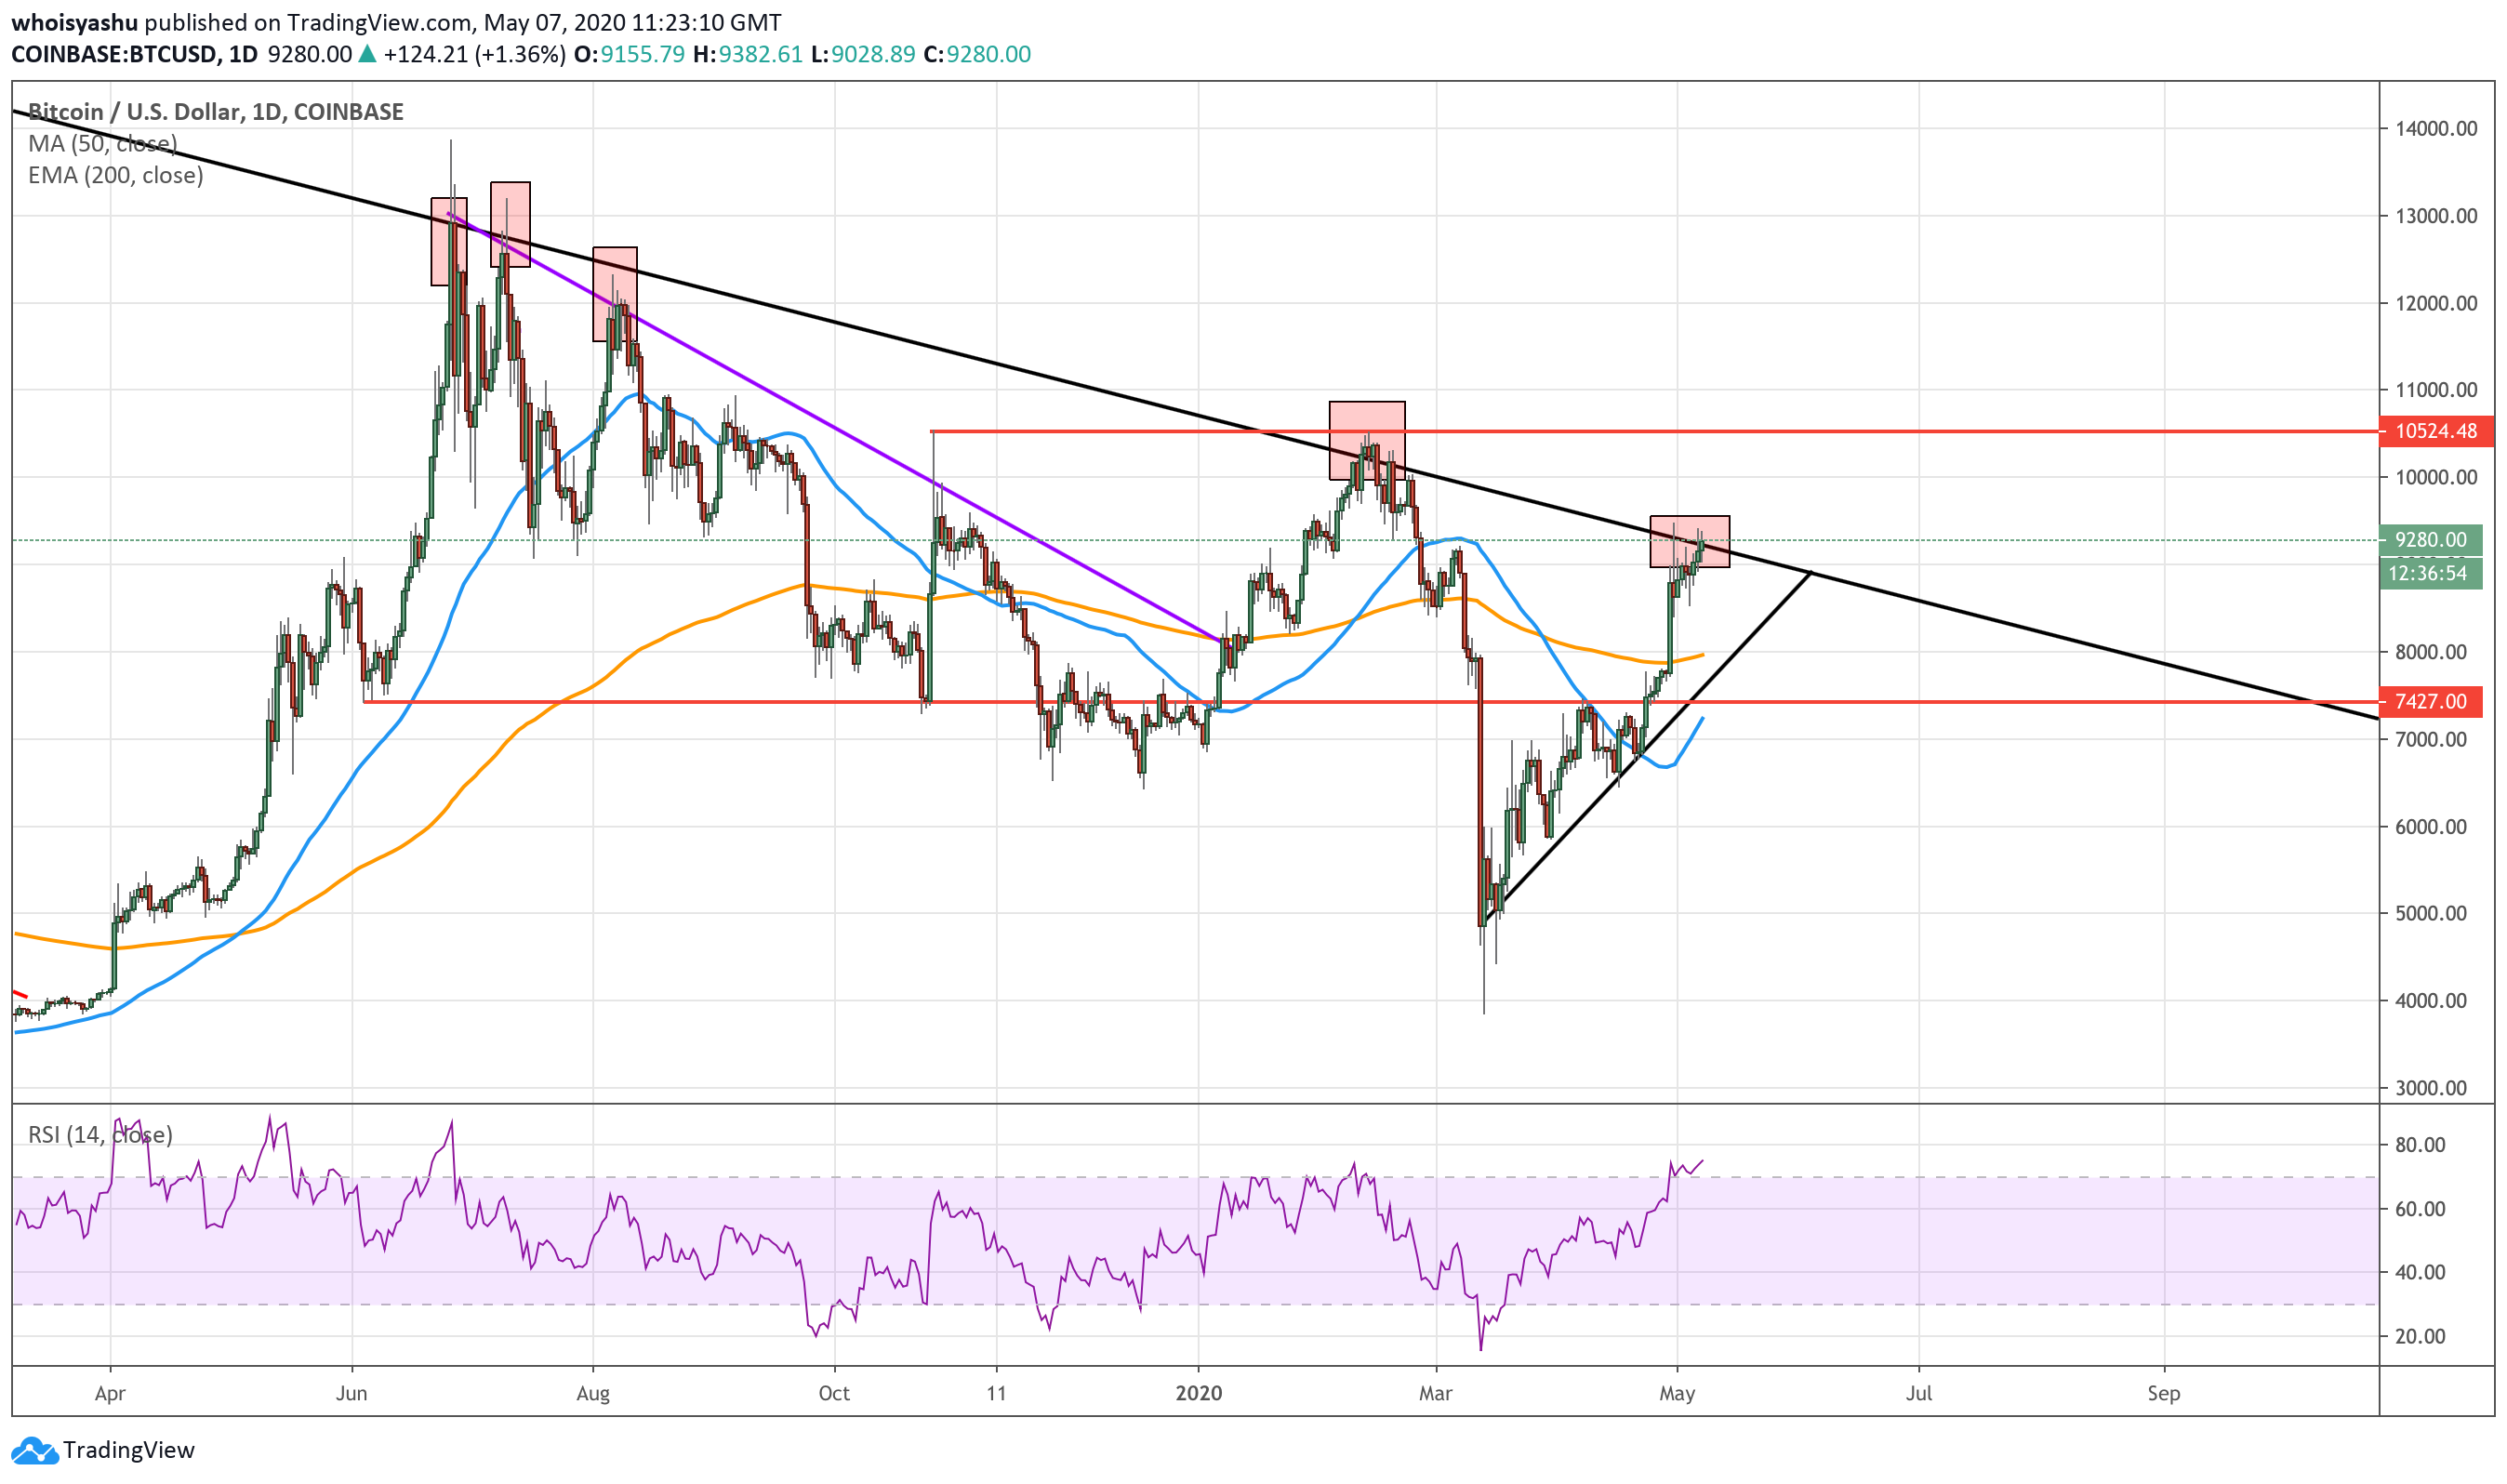
Moreover, the $6,400-level coincides with Bitcoin’s long-term Descending Trendline, a historically accurate resistance level since December 2017. The small red bars in the chart above show how the cryptocurrency’s every upside attempt never flourished into a bull run after testing the Trendline resistance.
The combination of two substantial price ceilings served as a hint of a deeper pullback.
Consolidation before Drop
Traders are at best cautious near the $6,400-$6,500 resistance area, waiting for whales to decide the next market bias. The wait-and-watch sentiment surfaces in the wake of bitcoin’s mining reward halving on May 12. Traders expect the event to cause a FOMO price rally that would serve near-term profitable opportunities in both the spot and derivatives market.
The trend is highly visible on the Chicago Mercantile Exchange (CME). The derivative exchange spotted a dramatic surge in the total number of open bitcoin futures contracts – it rose to $399 million as on Thursday, its highest since May 2019. The resurgence marked the entry of professional traders into the market.
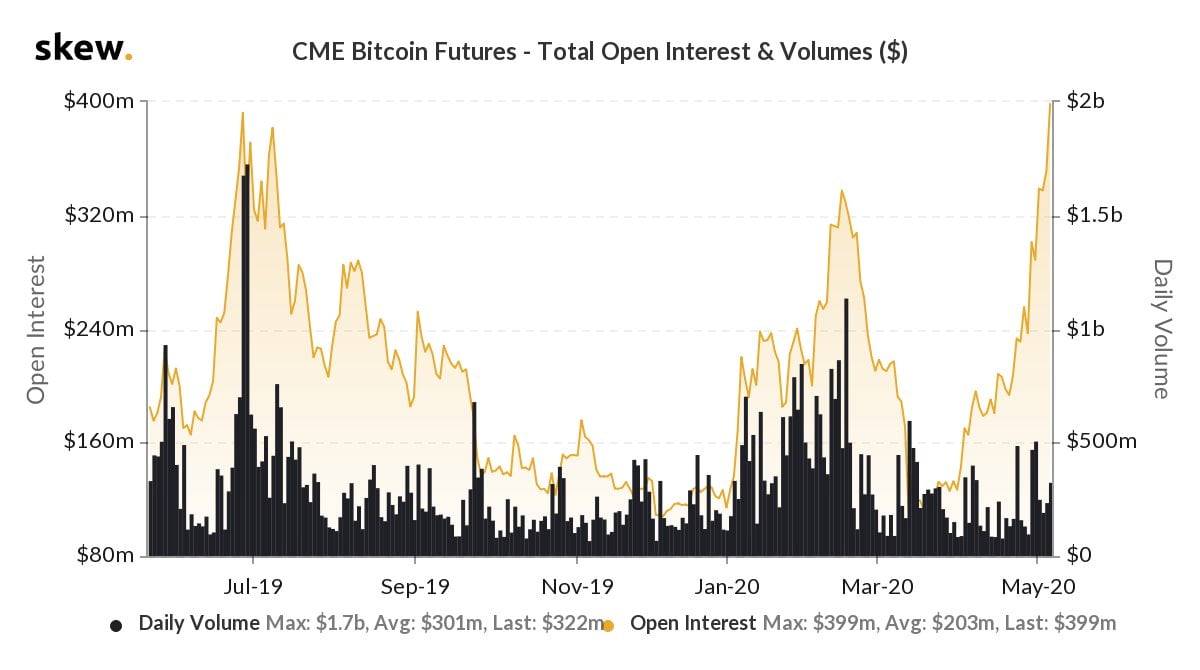
But the OI tops also followed deeper pullbacks in bitcoin’s spot prices, as shown in the Skew graph above. Overall, the OI-price uptrends appear as a cycle. And as bitcoin near its crucial resistance levels, the current OI-price uptrend could exhaust, as well.
Bitcoin now risks falling to $8,500 as the first sign of a correction. An extended plunge could have it test the 50-day moving average wave (blued). By then, the 50-DMA would coincide with $7,500 – historical support.
Photo by Goh Rhy Yan on Unsplash