Reason to trust
How Our News is Made
Strict editorial policy that focuses on accuracy, relevance, and impartiality
Ad discliamer
Morbi pretium leo et nisl aliquam mollis. Quisque arcu lorem, ultricies quis pellentesque nec, ullamcorper eu odio.
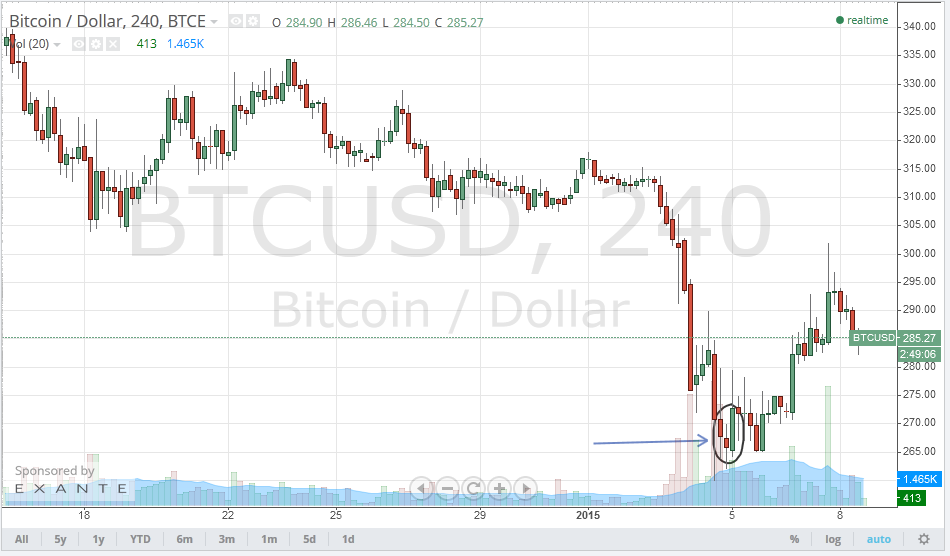
2015 started with a decline in the price of BTC/USD, which was bad news to all BTC traders and speculators. The New Year’s downtrend continued until it reached 265.24$ which is a point of support. “Bullish engulfing” could be noted on the BTC/USD 4 hour chart (The arrow points to the sign in the chart), which signaled a reversal in the downtrend and BTC/USD exceeded 300$ on the 7th of January, which can represent a 50% correction of the downtrend starting earlier this month.
The price of BTC/USD is likely to fall again before we can see a reversal of the current downtrend. A “bearish harami” was noted on the BTC/USD 4 hour charts and signaled falling of the price at 4:00 am earlier today (The circle and the arrow on the following chart) and the price fell below 284$. The price of BTC/USD is likely to continue dropping until reaching the 265$ support mark, which is close to the exponential low moving average.
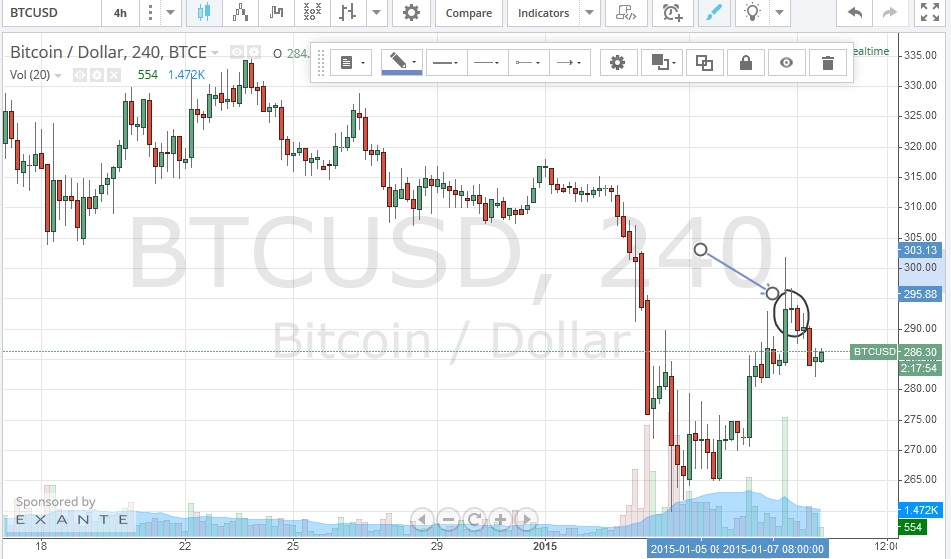
So, it is recommended to go short with a take profit near the 265$ mark, with a stop loss at around 295$ which represents a new resistance. Long positions can be more likely profitable after testing the 265$ support mark, which is probably where the downtrend would reverse based on the weekly exponential moving averages.


Tip sent http://imgur.com/lYhysV6. Another would be to stay short. Thanks for the post.