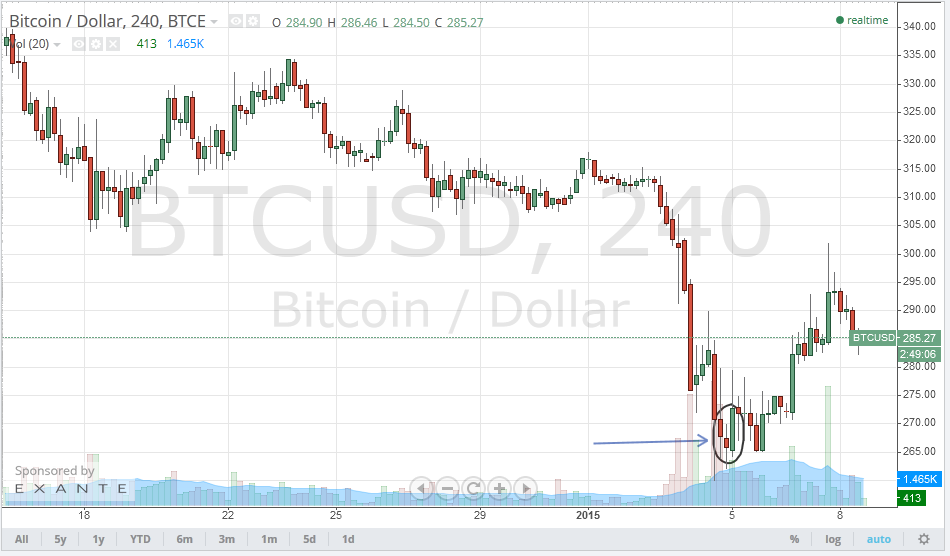
2015 started with a decline in the price of BTC/USD, which was bad news to all BTC traders and speculators. The New Year’s downtrend continued until it reached 265.24$ which is a point of support. “Bullish engulfing” could be noted on the BTC/USD 4 hour chart (The arrow points to the sign in the chart), which signaled a reversal in the downtrend and BTC/USD exceeded 300$ on the 7th of January, which can represent a 50% correction of the downtrend starting earlier this month.
The price of BTC/USD is likely to fall again before we can see a reversal of the current downtrend. A “bearish harami” was noted on the BTC/USD 4 hour charts and signaled falling of the price at 4:00 am earlier today (The circle and the arrow on the following chart) and the price fell below 284$. The price of BTC/USD is likely to continue dropping until reaching the 265$ support mark, which is close to the exponential low moving average.
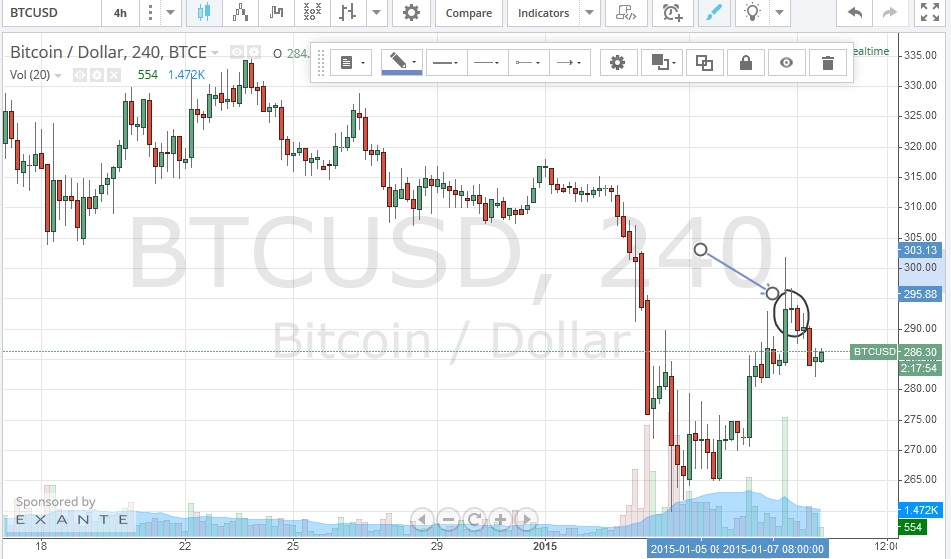
So, it is recommended to go short with a take profit near the 265$ mark, with a stop loss at around 295$ which represents a new resistance. Long positions can be more likely profitable after testing the 265$ support mark, which is probably where the downtrend would reverse based on the weekly exponential moving averages.