

Cardano is in a downtrend today, April 17, after its steady rally since April 11. Its positive price trend in April sparked hope for a significant rally. However, the bears returned to provide resistance to the ongoing rally.
ADA’s price dropped by more than 2% in the last 24 hours, while the trading volume is down by 22.72% within the same time frame. Despite the prevailing bearish trend, ADA has retained most of its gains in 2023.
It traded at $0.2498 on January 1, 2023, and is currently at $0.44 at press time, a significant increase. Like other cryptocurrencies, ADA is volatile. So, is this recent move a new bearish trend or a temporary correction?
ADA Loses Momentum At $0.45 But Still Primed To Explode
ADA dipped at the $0.45 mark today to retest old support levels. However, this drop in its price will likely be temporary as the previous price action stemmed from recent developmental activities.
The Cardano community has distinguished itself as a developmental hub with approximately 1,225 projects currently building on Cardano. These projects make the ecosystem attractive for developers and investors alike.
One such new addition is Lace 1.0, a light multifunctional wallet platform launched on the Mainnet on April 11, 2023. Such innovations spiked interest in the crypto community for Cardano as an operational base.
Also, these activities helped boost its price from the $0.2 level to the $0.44 level. Despite the current slump, ADA may resume its uptrend once there is sufficient bullish pressure.
When Will The Cardano Price Rally?
ADA formed a red candle, seeing a second consecutive red day on the daily chart. The bulls rallied since April 7, with the price increase between April 13-15 being the most significant. Cardano exhibited a similar price pattern when it rallied between January 4 -14. A price decline occurred between January 15-18 before a resumption of the uptrend on January 19.
ADA is still trading above its 50-day and 200-day Simple Moving Averages (SMA), with bullish sentiment in the short and long term. Also, the Relative Strength Index (RSI) is 68.38, close to the overbought region of 70. The RSI is returning from the overbought zone back into the channel. However, it still reflects the buying pressure in the market.

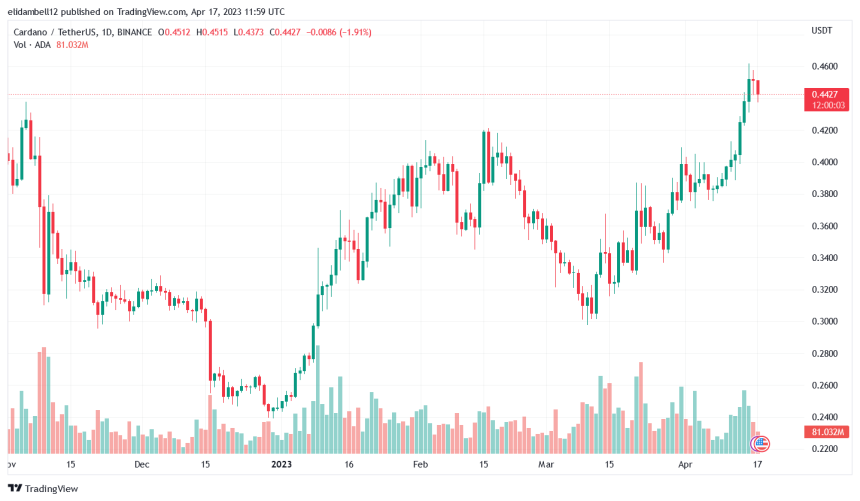
ADA’s Moving Average Convergence/ Divergence (MACD) is above its signal line, indicating bullish pressure. The current price decrease for ADA closely mirrors its past price action in January 2023. ADA will likely resume its uptrend by April 20 and reclaim the $0.45 price level if the bulls prevail.
Featured image from Pixabay and chart from Tradingview