

Over the last week, Chainlink lost most of the gains it secured in the previous two months. In the past week, LINK depreciated by close to 6%. On the daily chart, Chainlink fell by 4% and is moving close to its immediate support level.
The overall structure of Chainlink remained bearish at the time of writing. Demand for the altcoin remained low as buying pressure couldn’t recover over the past few weeks. Accumulation dipped on the chart too.
For buyers to regain strength on their charts, the altcoin has to stay above its immediate price floor. The bulls could recover over the subsequent trading sessions if that support level remains steady.
The LINK price continued to move on a descending trendline, but a slight push from buyers could bring the altcoin to trade near its overhead price ceiling. For Chainlink to secure gains, broader market strength remains crucial. Bitcoin has to trade above the $24,000 price for major altcoins to appreciate on their respective charts.
Chainlink Price Analysis: One-Day Chart

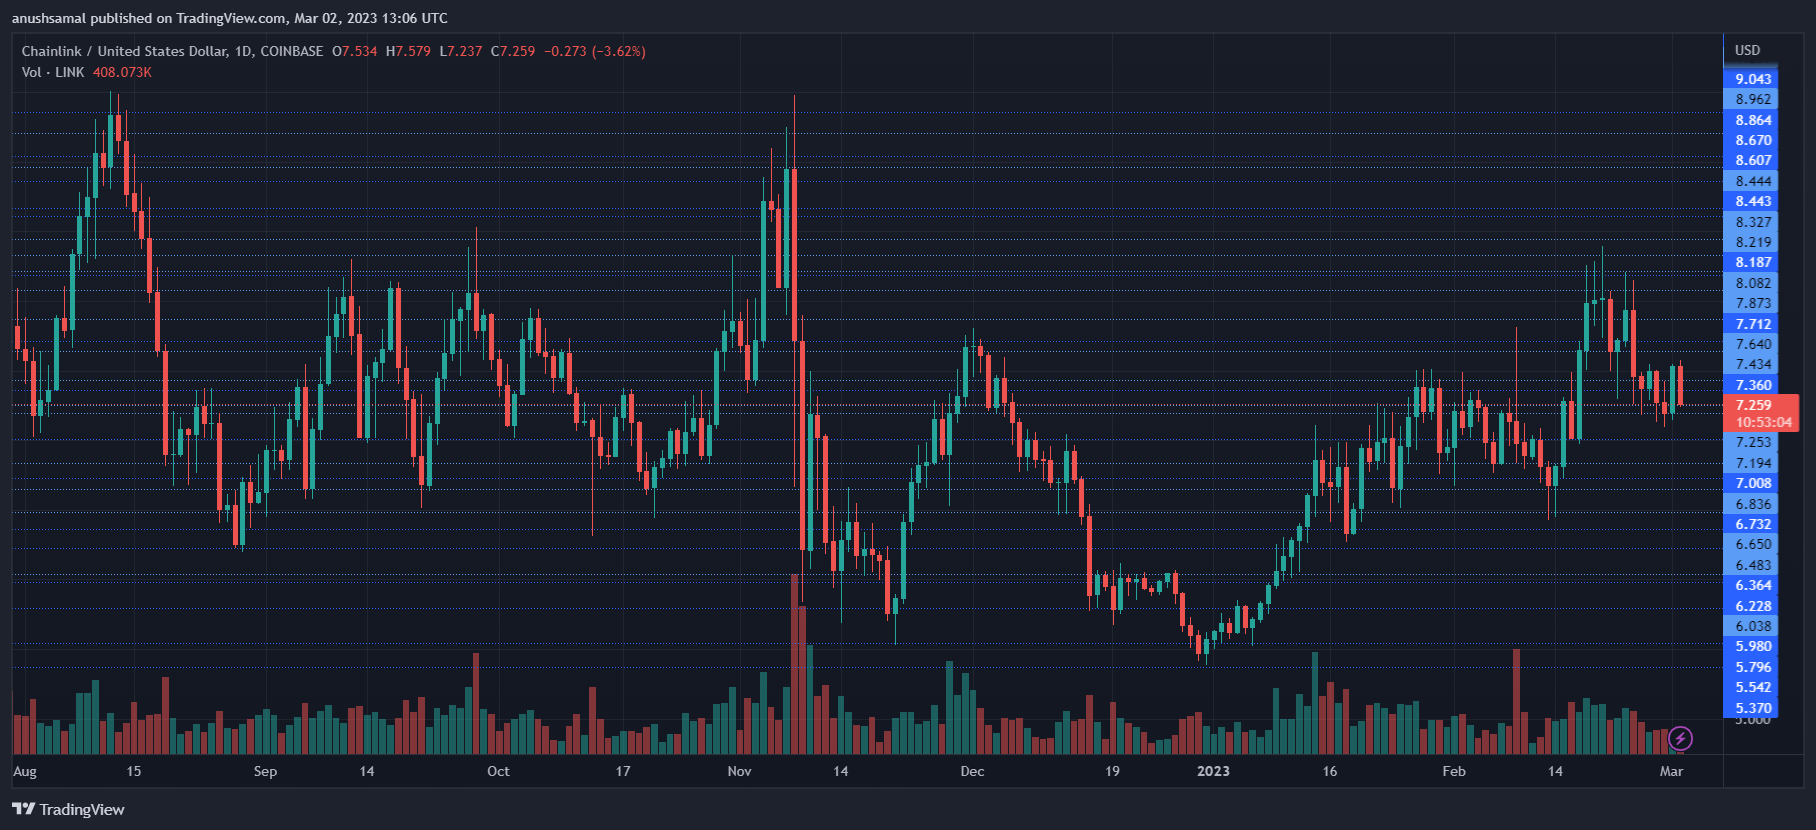
LINK was trading at $7.20 at the time of writing. The coin has to remain on the local support line for it to witness recovery. If LINK falls through the $7 mark, it will bring back the bears in full force.
If LINK loses the $7 mark, it will park at $6.80. Overhead resistance for the altcoin was $7.60; breaching that level will take the altcoin to $7.80. If LINK remains above $7.80 for a considerable period, it could target $8.
Trading at $8 will invalidate the bearish thesis. The amount of Chainlink traded in the last session declined, meaning the buying strength remained low on the chart.
Technical Analysis

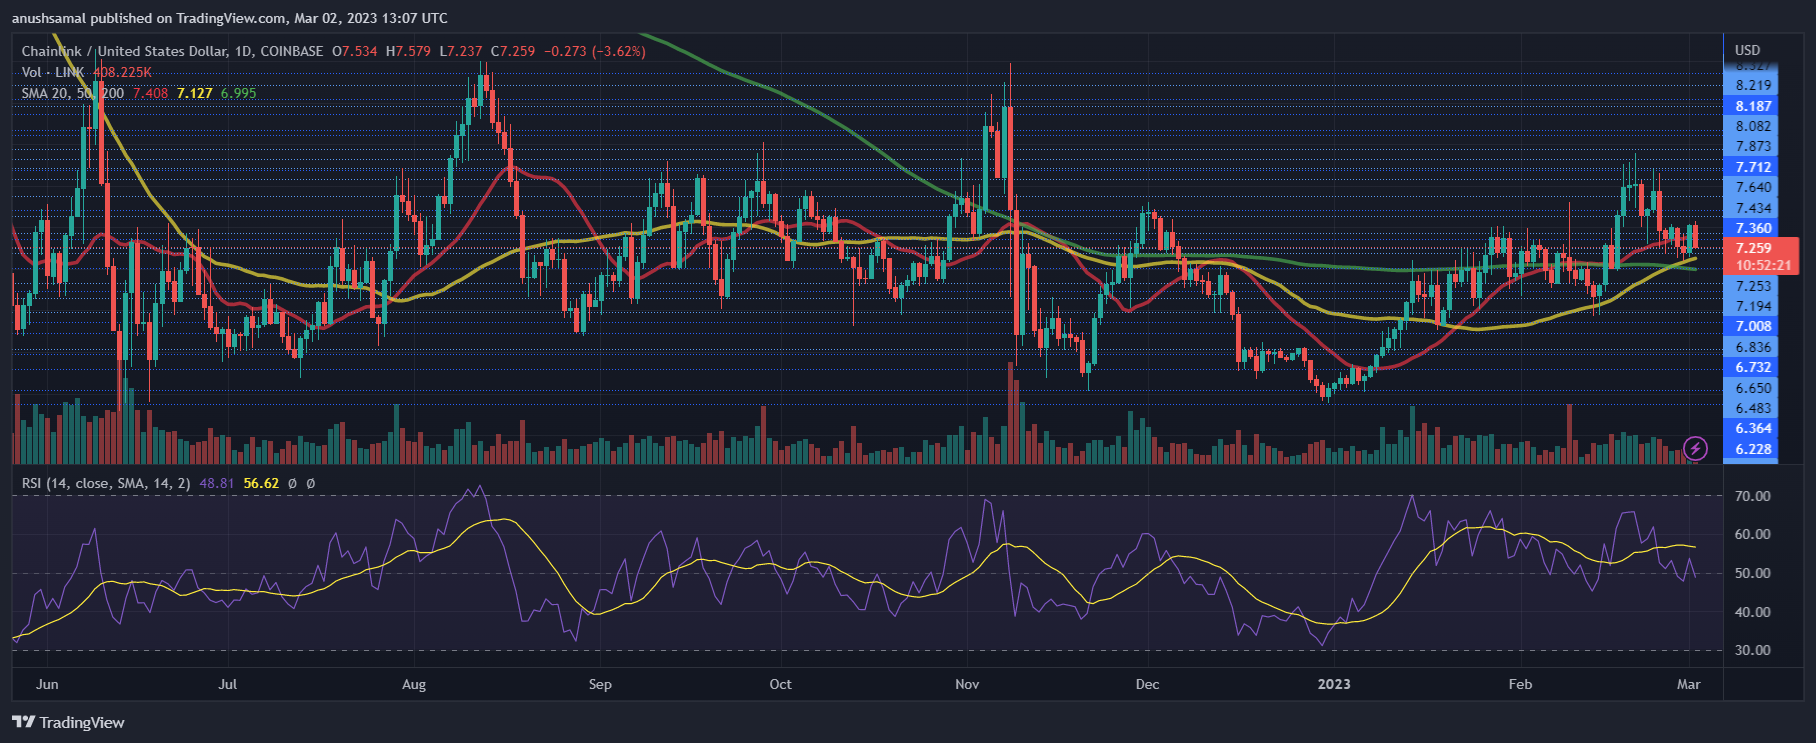
Over the last few weeks, buying strength has constantly attempted to recover but has met with resistance from the bears each time. The Relative Strength Index fell below the neutral zone, indicating bearish strength.
It suggested sellers had the upper hand; the indicator also formed a downtick. On the same note, the asset price slipped below the 20-Simple Moving Average (SMA) line as sellers continued to drive the price momentum in the market.
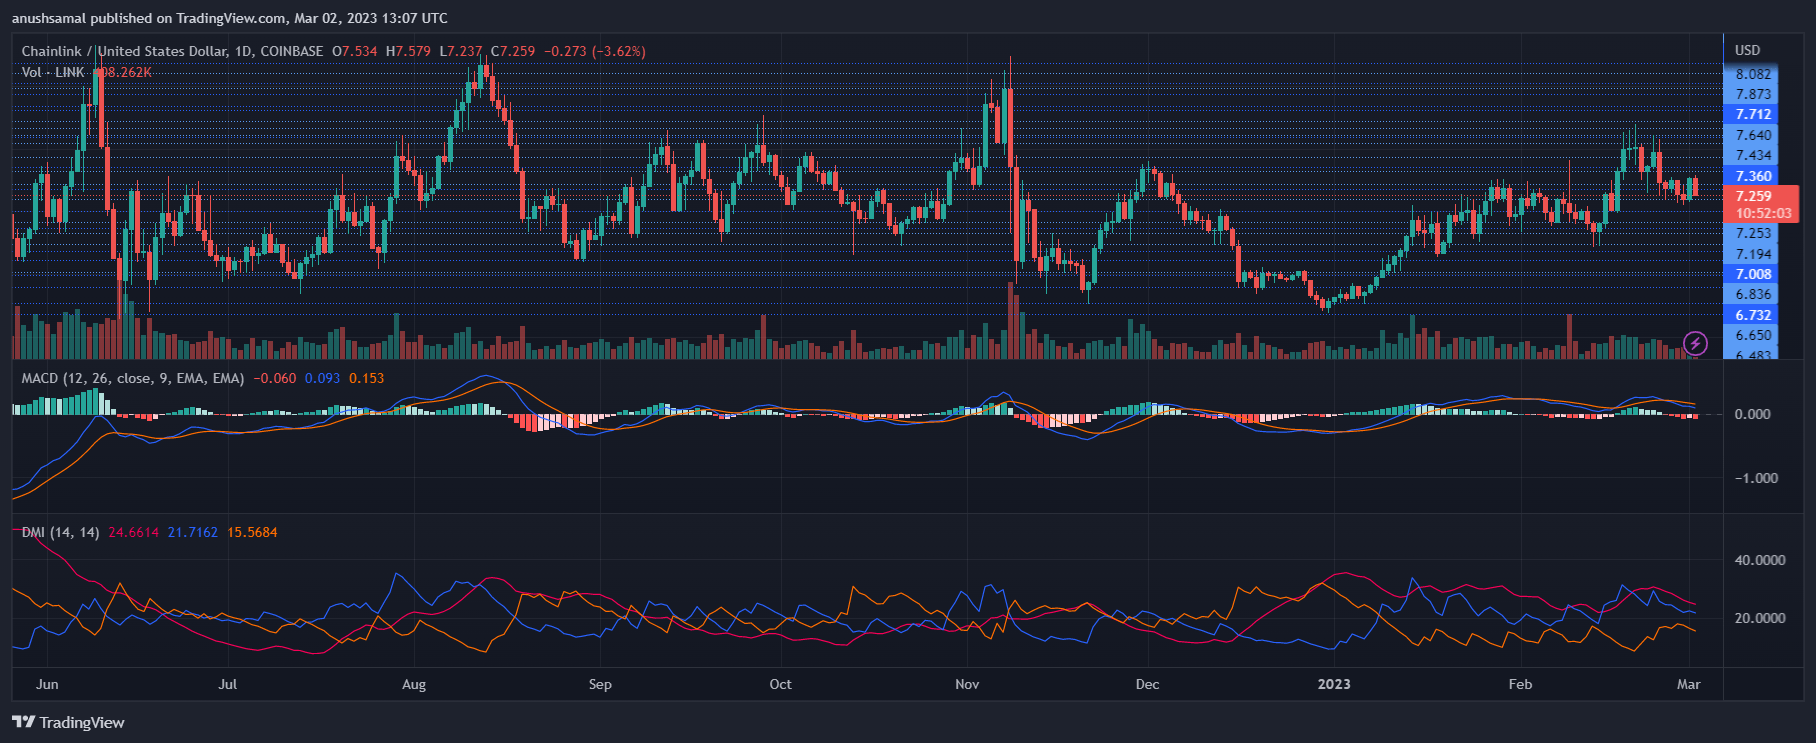
About the low buying pressure, the altcoin also displayed sell signals. The Moving Average Convergence Divergence depicted red histograms tied with sell signals. This often means the price can experience another fall over successive trading sessions.
The Directional Movement Index suggests the price direction and strength of the same. The negative indicator signaled downward price movement as the -DI line (orange) crossed over the +DI line (blue). The Average Directional Index (red) dropped near the 20-mark, which revealed that the present price trend was losing strength.